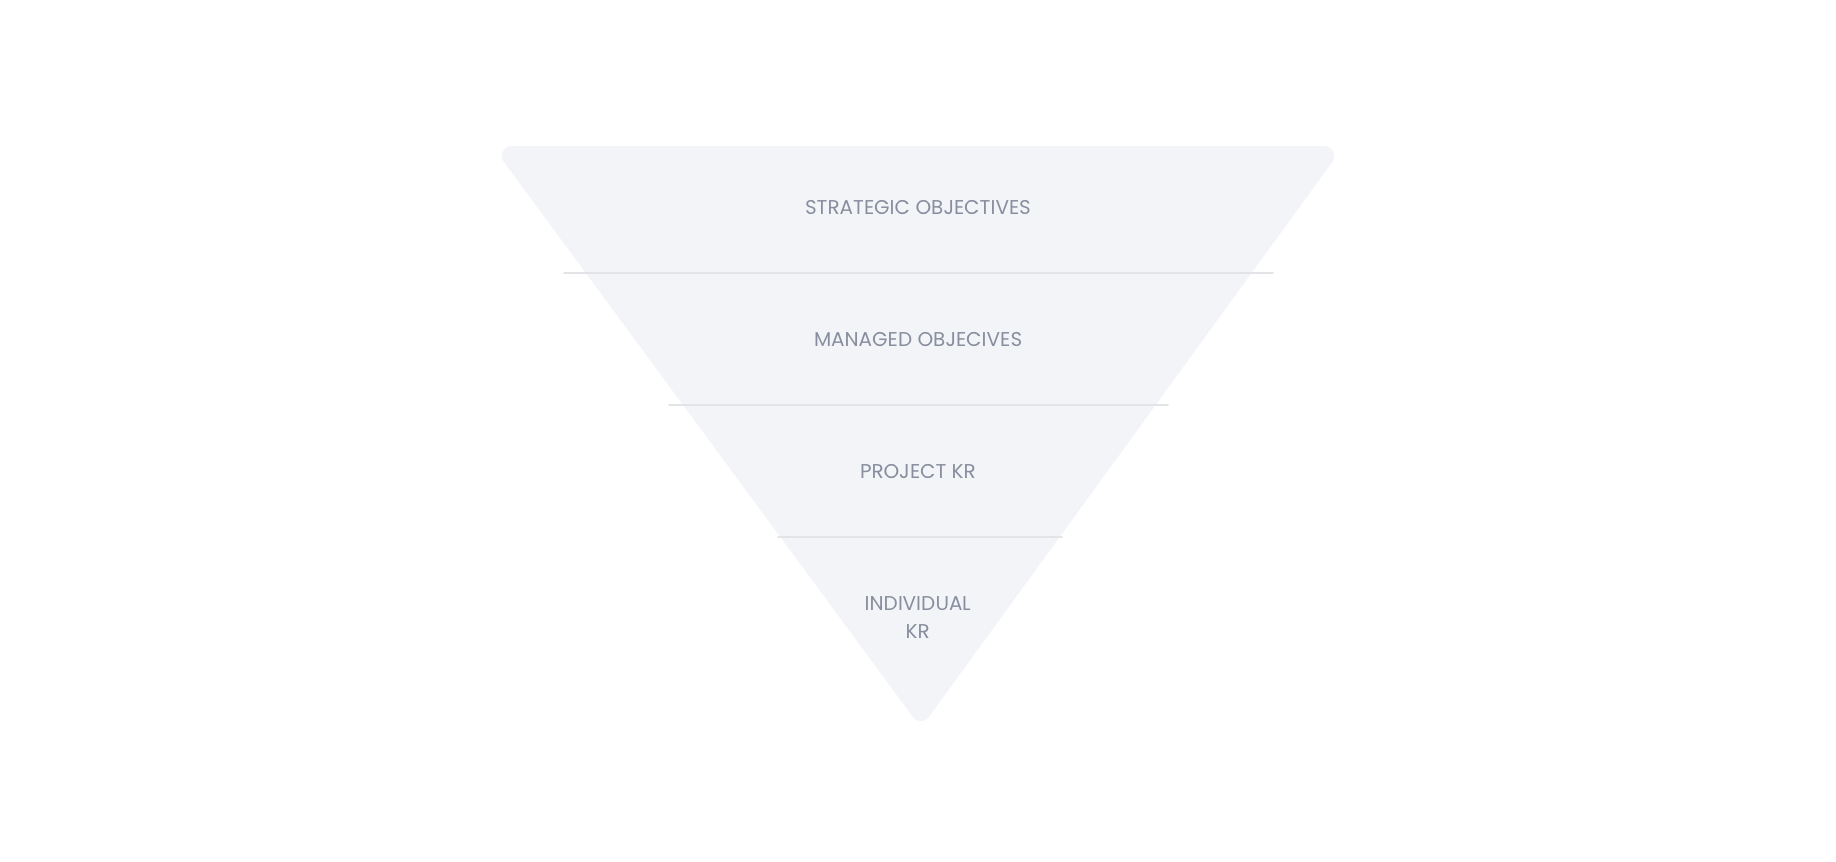
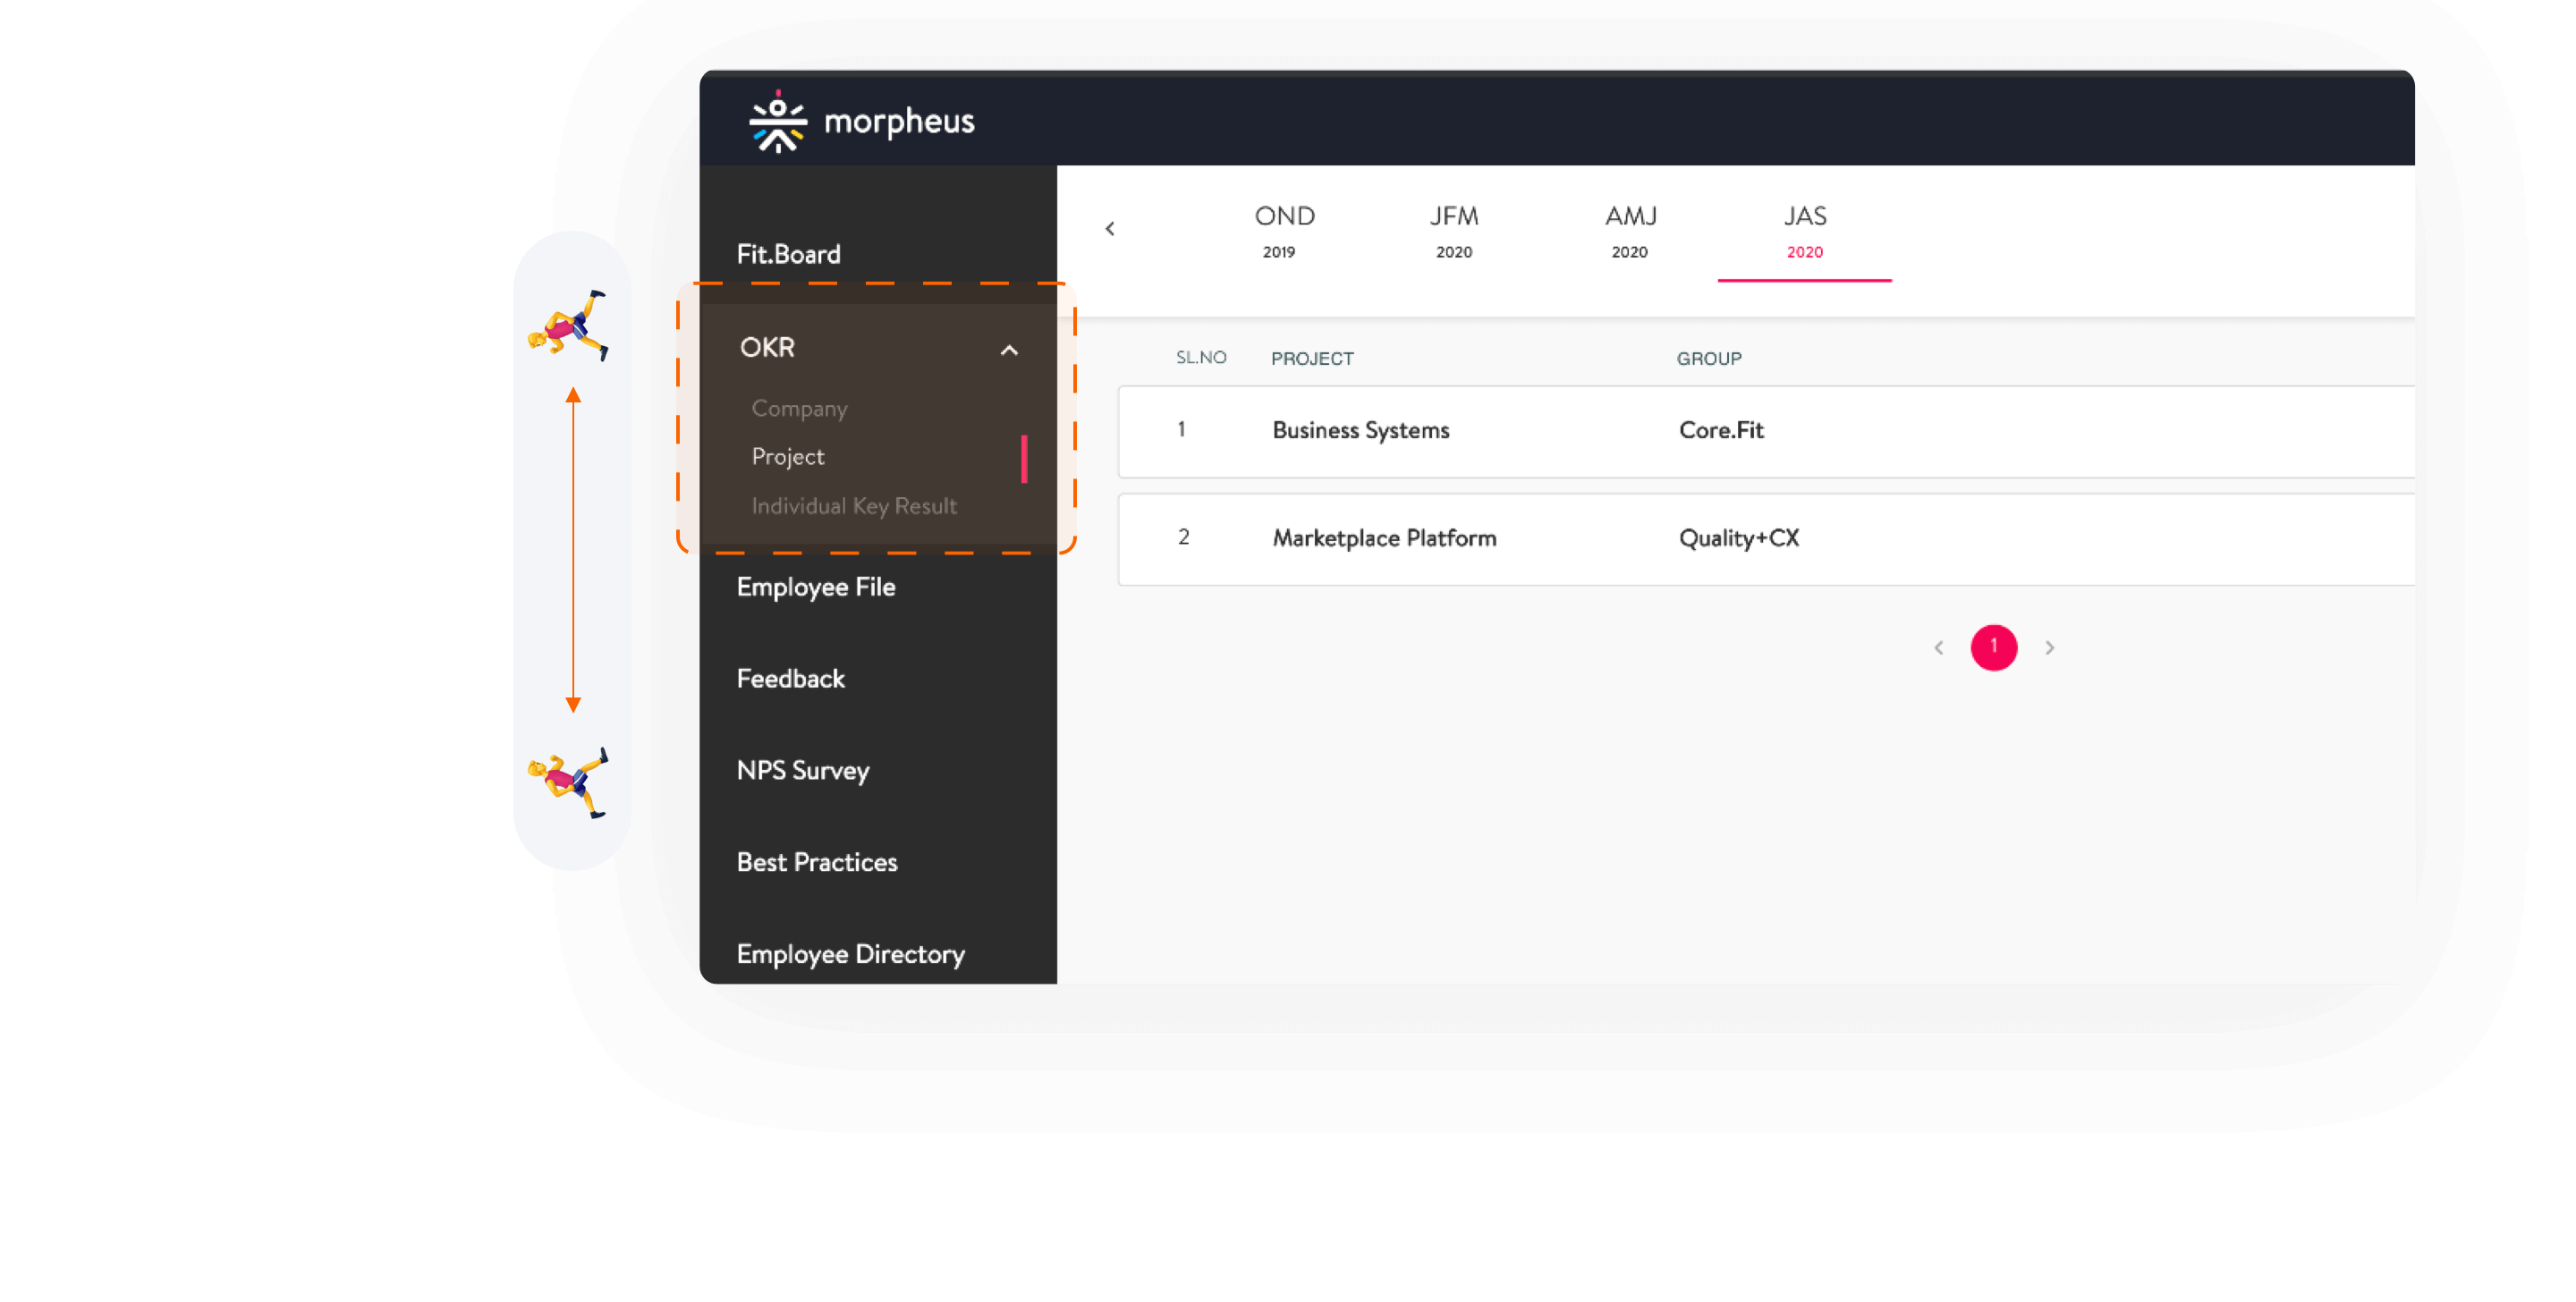
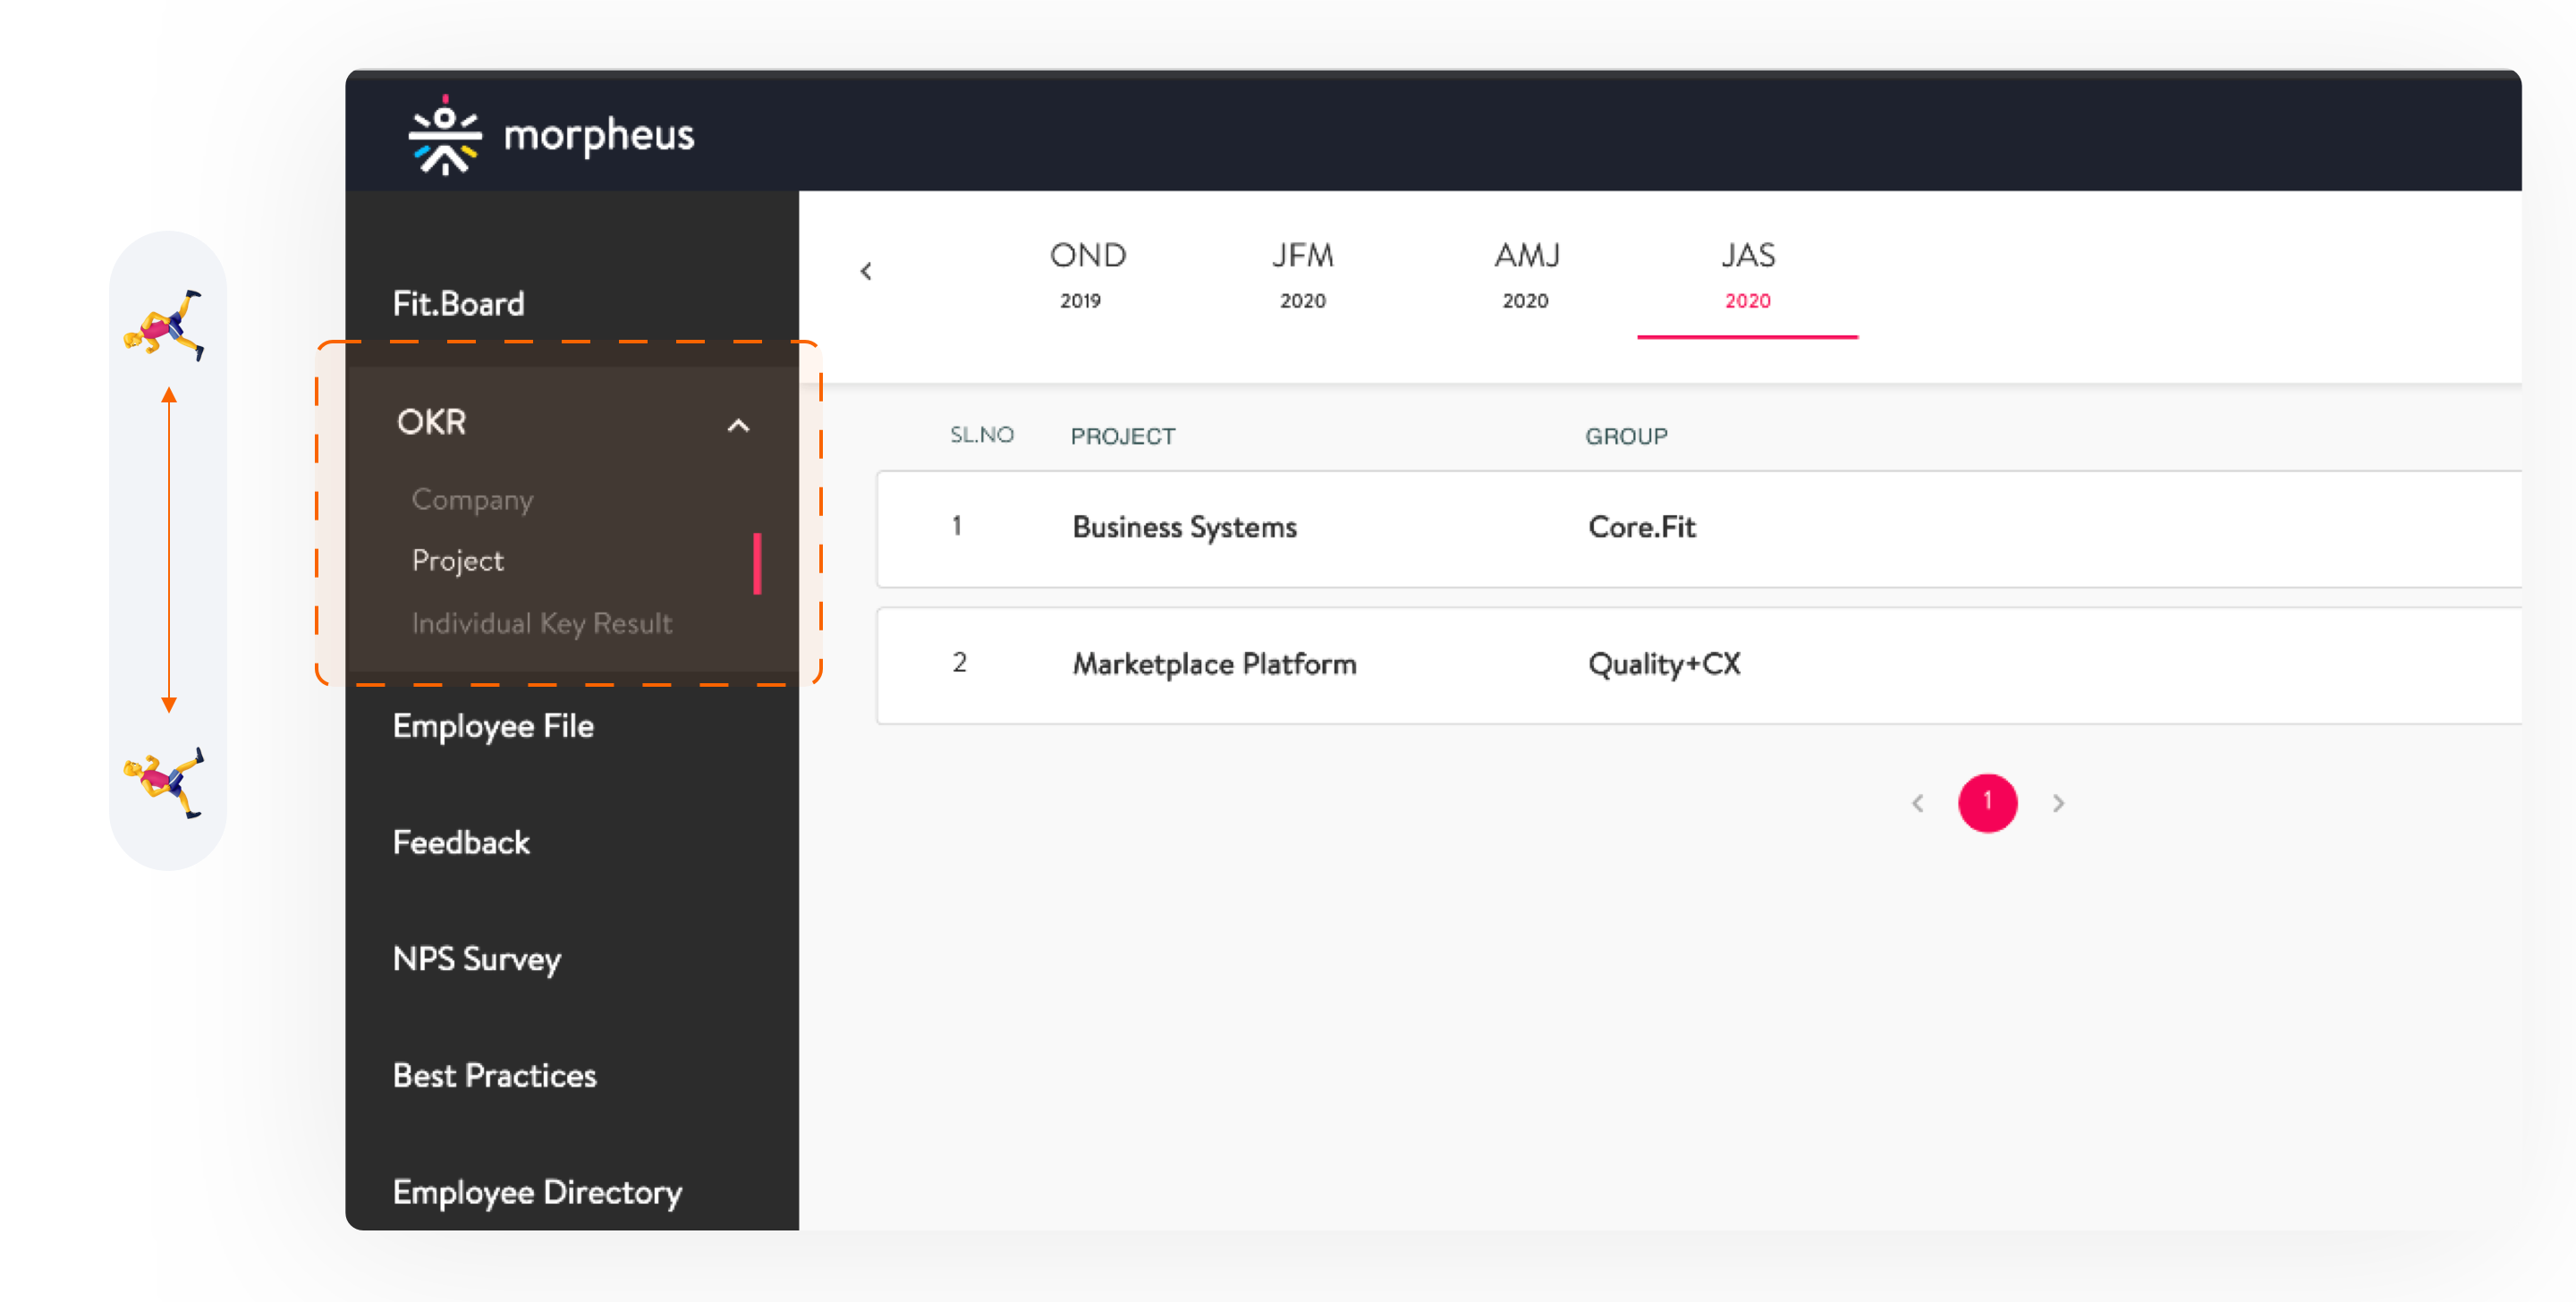
At Cure.fit top to bottom approach is followed for setting up OKRs. This means that there are specific company-level objectives linked to some project-level OKRs and again linked to several other OKRs to the very individual level.
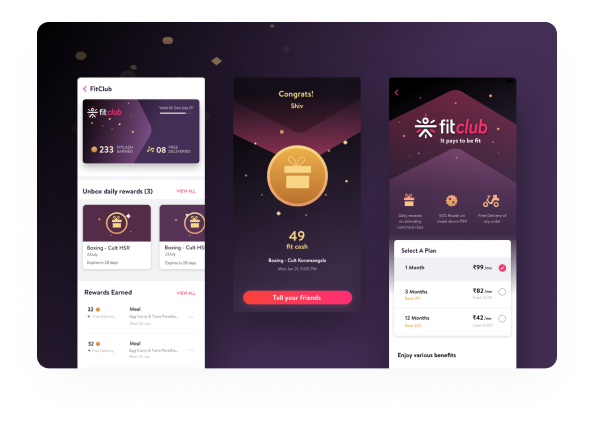
OKRs help provide direction to the work and ensure everyone in the organization is working towards the company's goals, thus creating a sense of ownership of your individual key results. OKRs are written in a particular set pattern recording the exact objective, what key result we are trying to achieve, and how we track it. Hence the name Objective Key Results.
OKRs are tracked and reviewed at the mid and end of every quarter using color codes. This helps understand the overall requirements and make sure that proper attention can be given to the required objectives.

Quarterly OKR Status Discussions are scheduled for every vertical in the organization with the co-founders and respective stakeholders. Everything is discussed in this, what went wrong, right, and further plan.
Respective vertical teams present the status of OKRs at the end of every quarter to the co-founders and further stakeholders of the company.
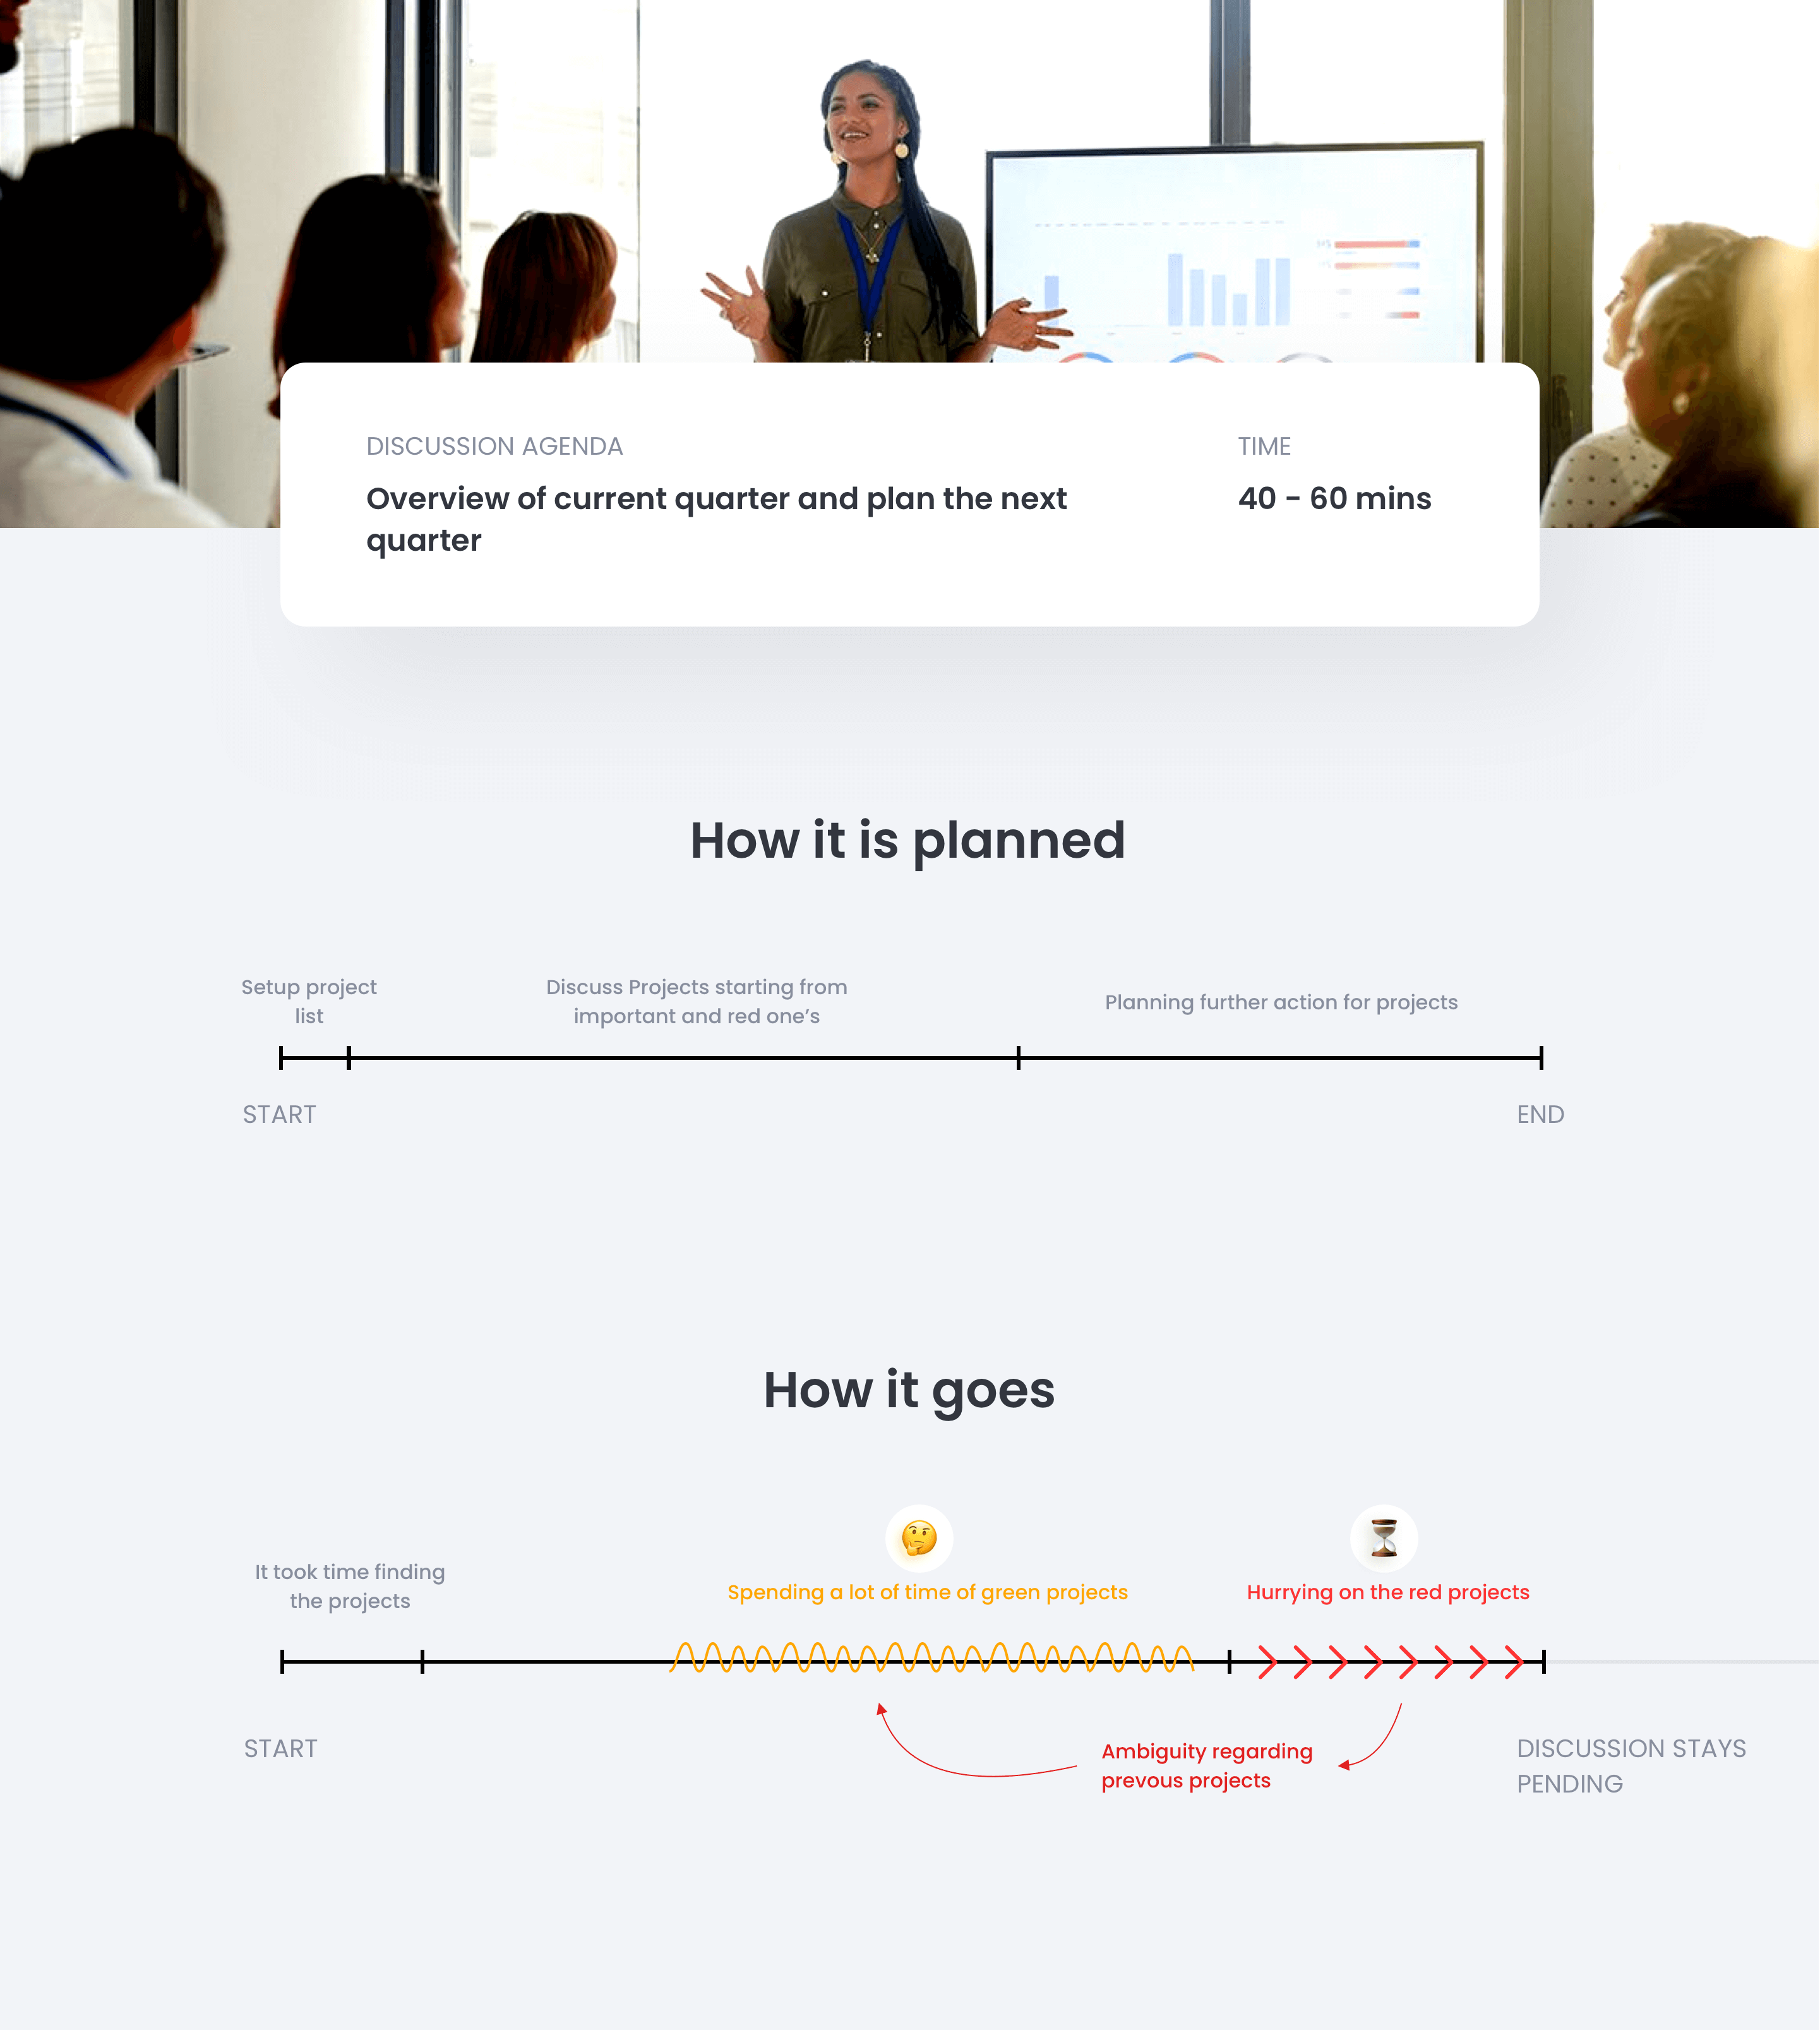
- Time is value, and in startups, time is money; extended discussion leads to many disruptions in further schedules.
- Being a larger hall meeting it is always difficult to schedule a follow up adversely impacting and delaying important decisions.
- Even if the meeting is scheduled, it is impossible to recollect everything properly, and a further context is required.
- It creates an overall grey area affecting a lot of decision-making around other things in the organisation.
For understanding the main reason for this delay, we need to understand our users and their goals first.
The exact user behaviour in a quarterly meeting cannot be replicated in a usability session. Thus, user observation during quarterly meetings and feedback collected across the organisation was the primary research mode for the project.
Our User goals:- Make sure everything is on the right track in a project. Focus on the key highlights and check the progress there.
- Check the reason if any project is falling back and also discuss plans for that. How things can be improved or if more resources are required.
- Discuss next quarter's goals according to the current progress and make sure they are inline with the company goals.
User observations and feedback sessions helped us collect a lot of qualitative data. All this data helped us list down the major pain points and go further about it.
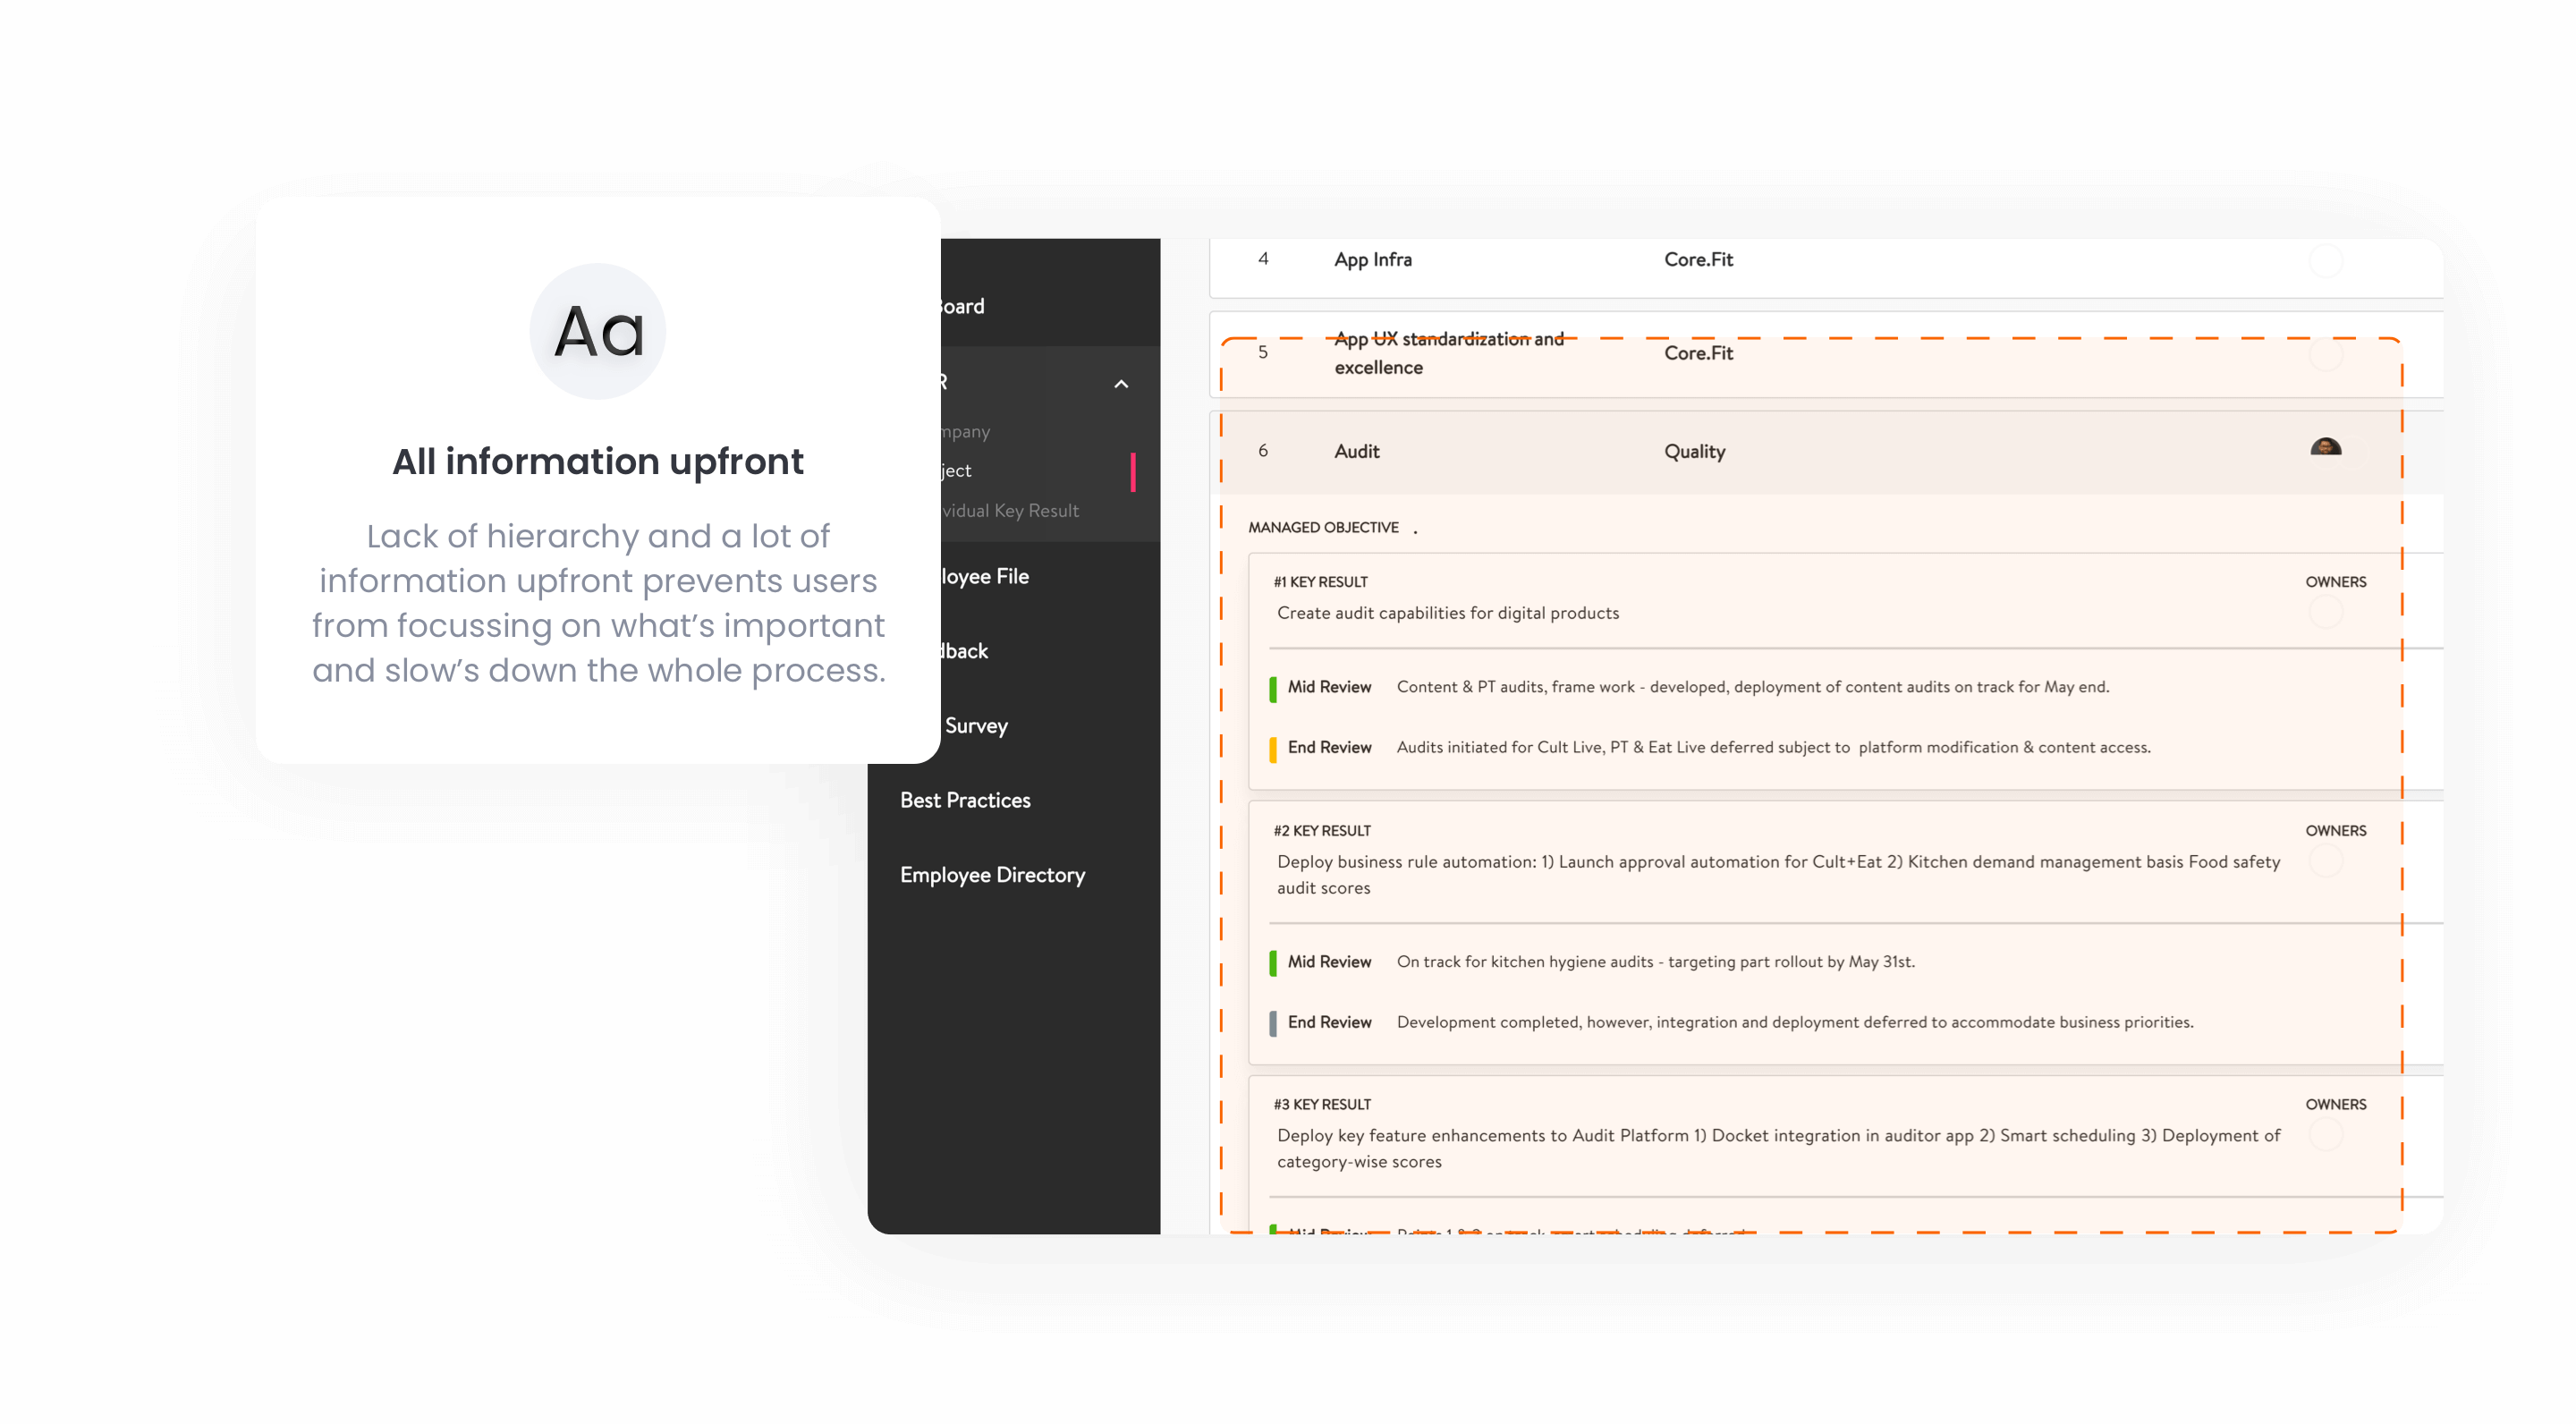
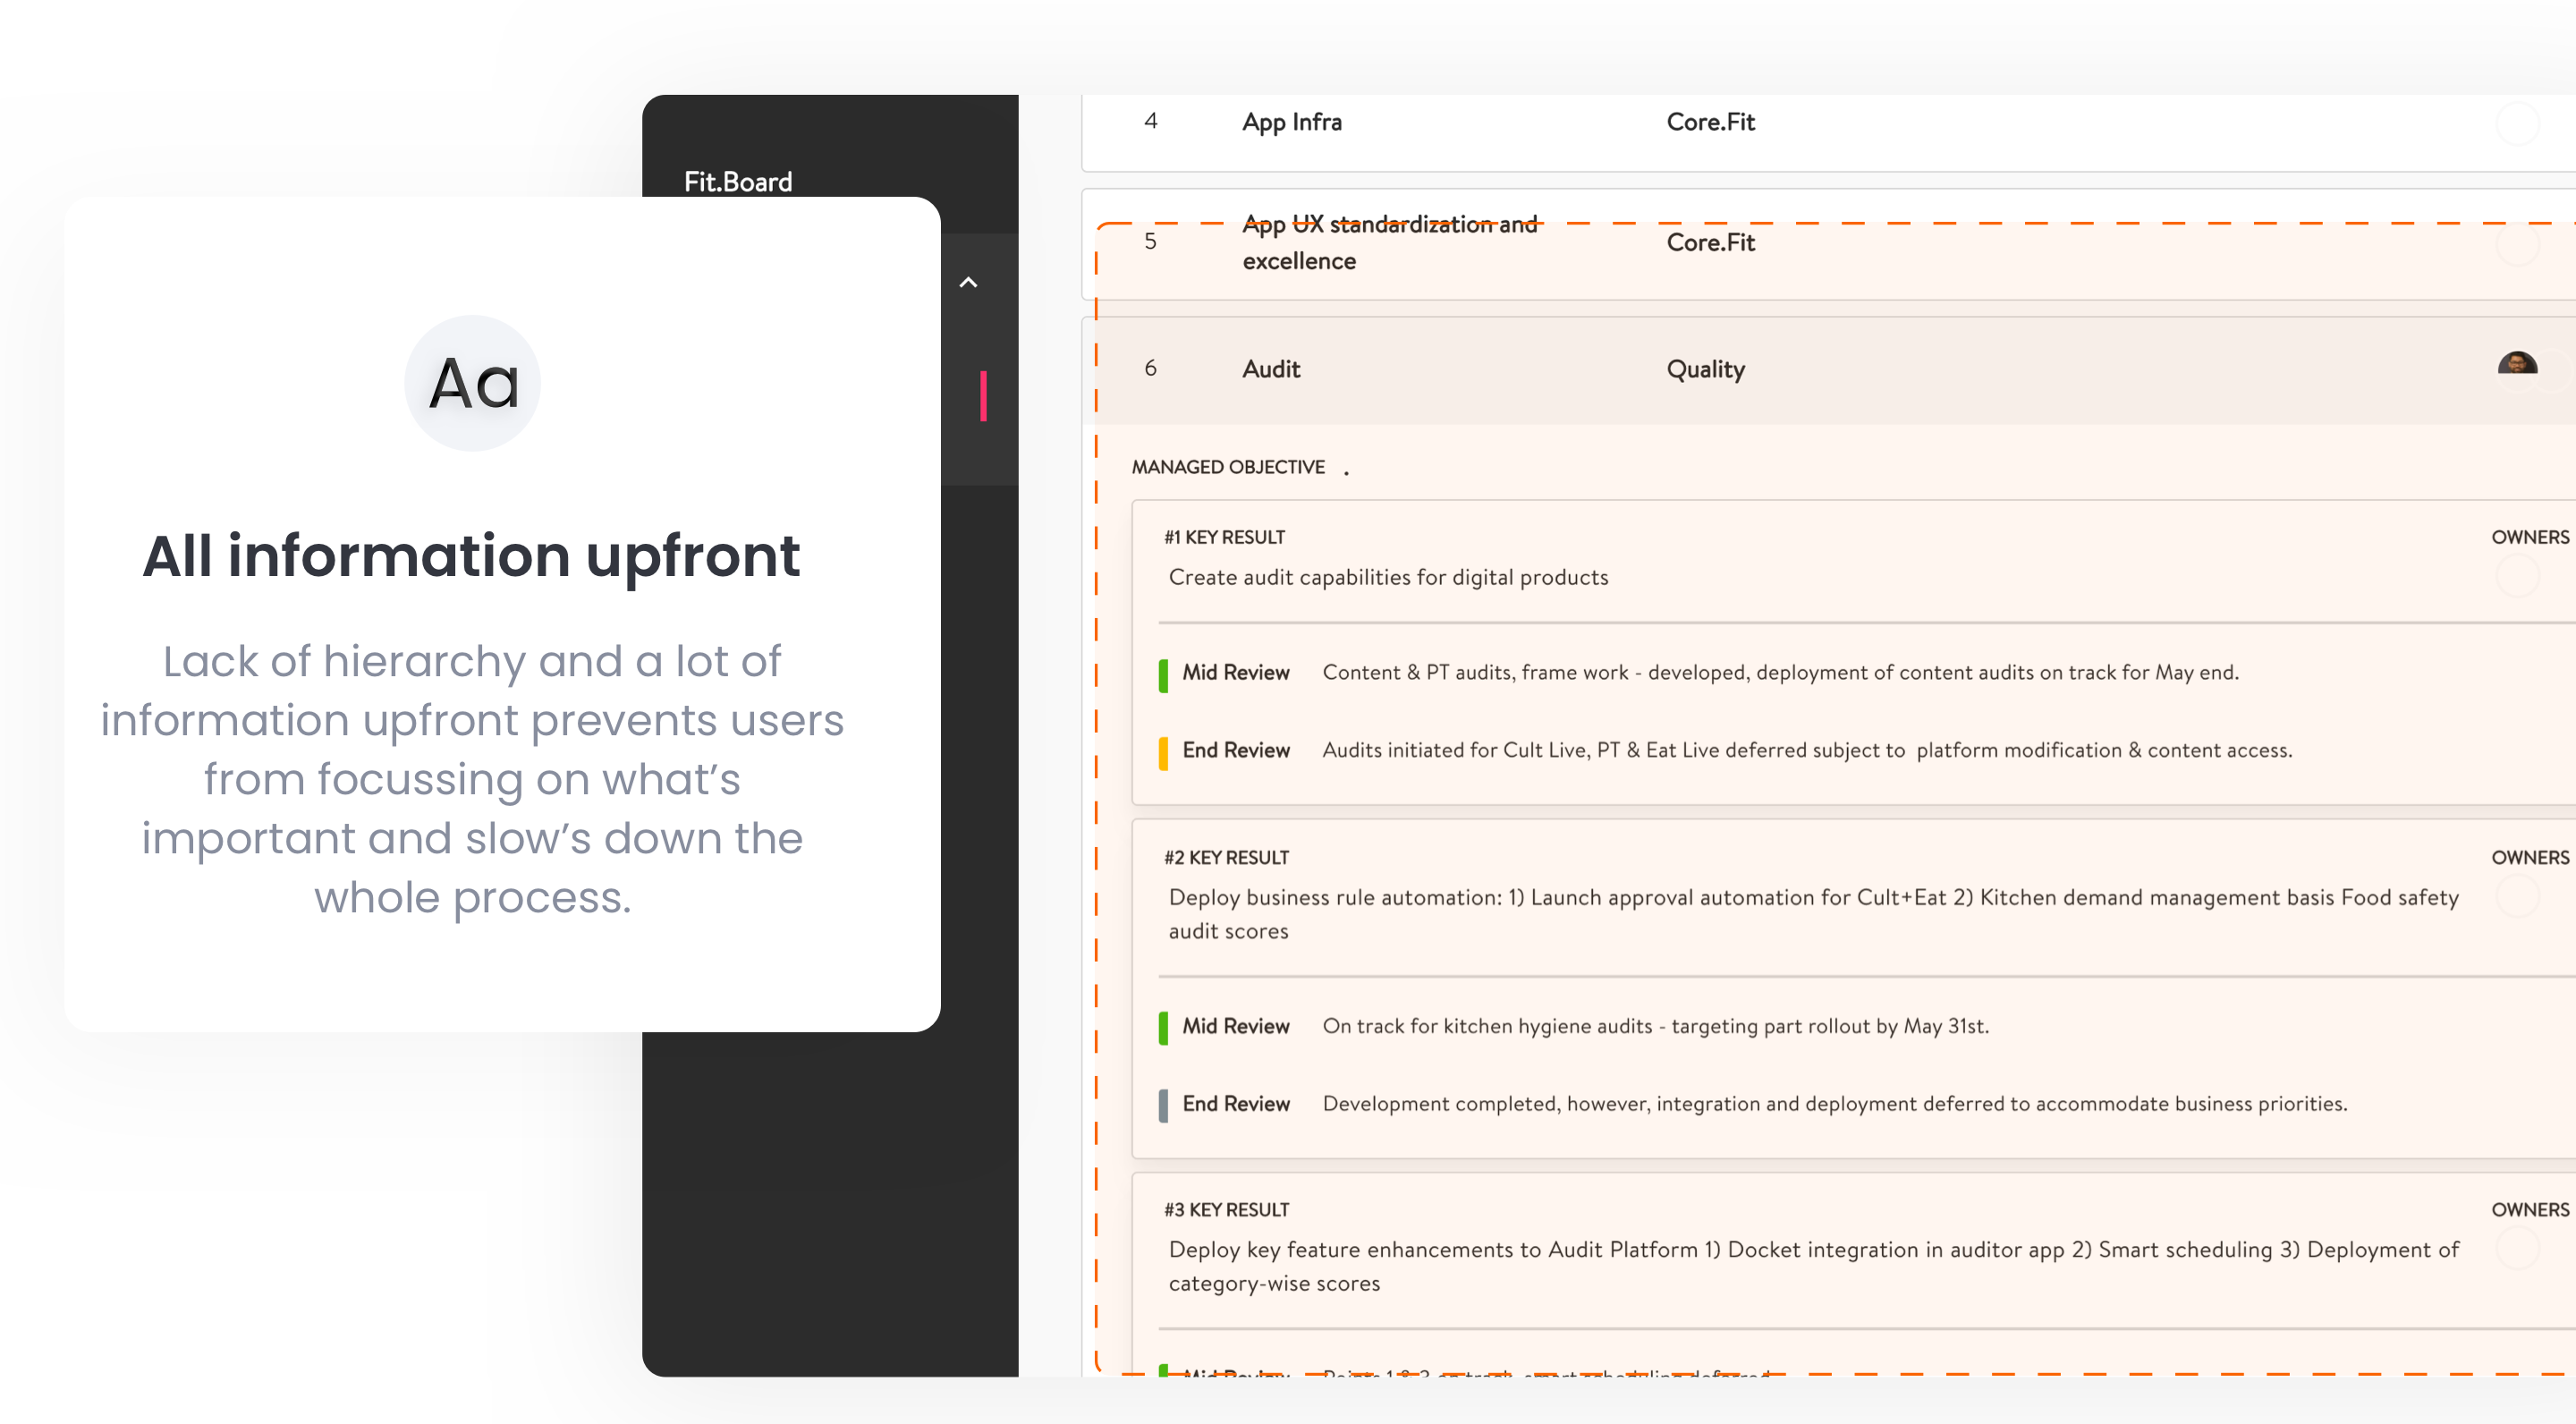
Built focussing on the managing aspect of OKRs, the portal provides no set way in which OKR's can be analyzed or discussed. The only way of checking individual projects is through filtering, and with less time in your hand, it becomes challenging for users to go this way.
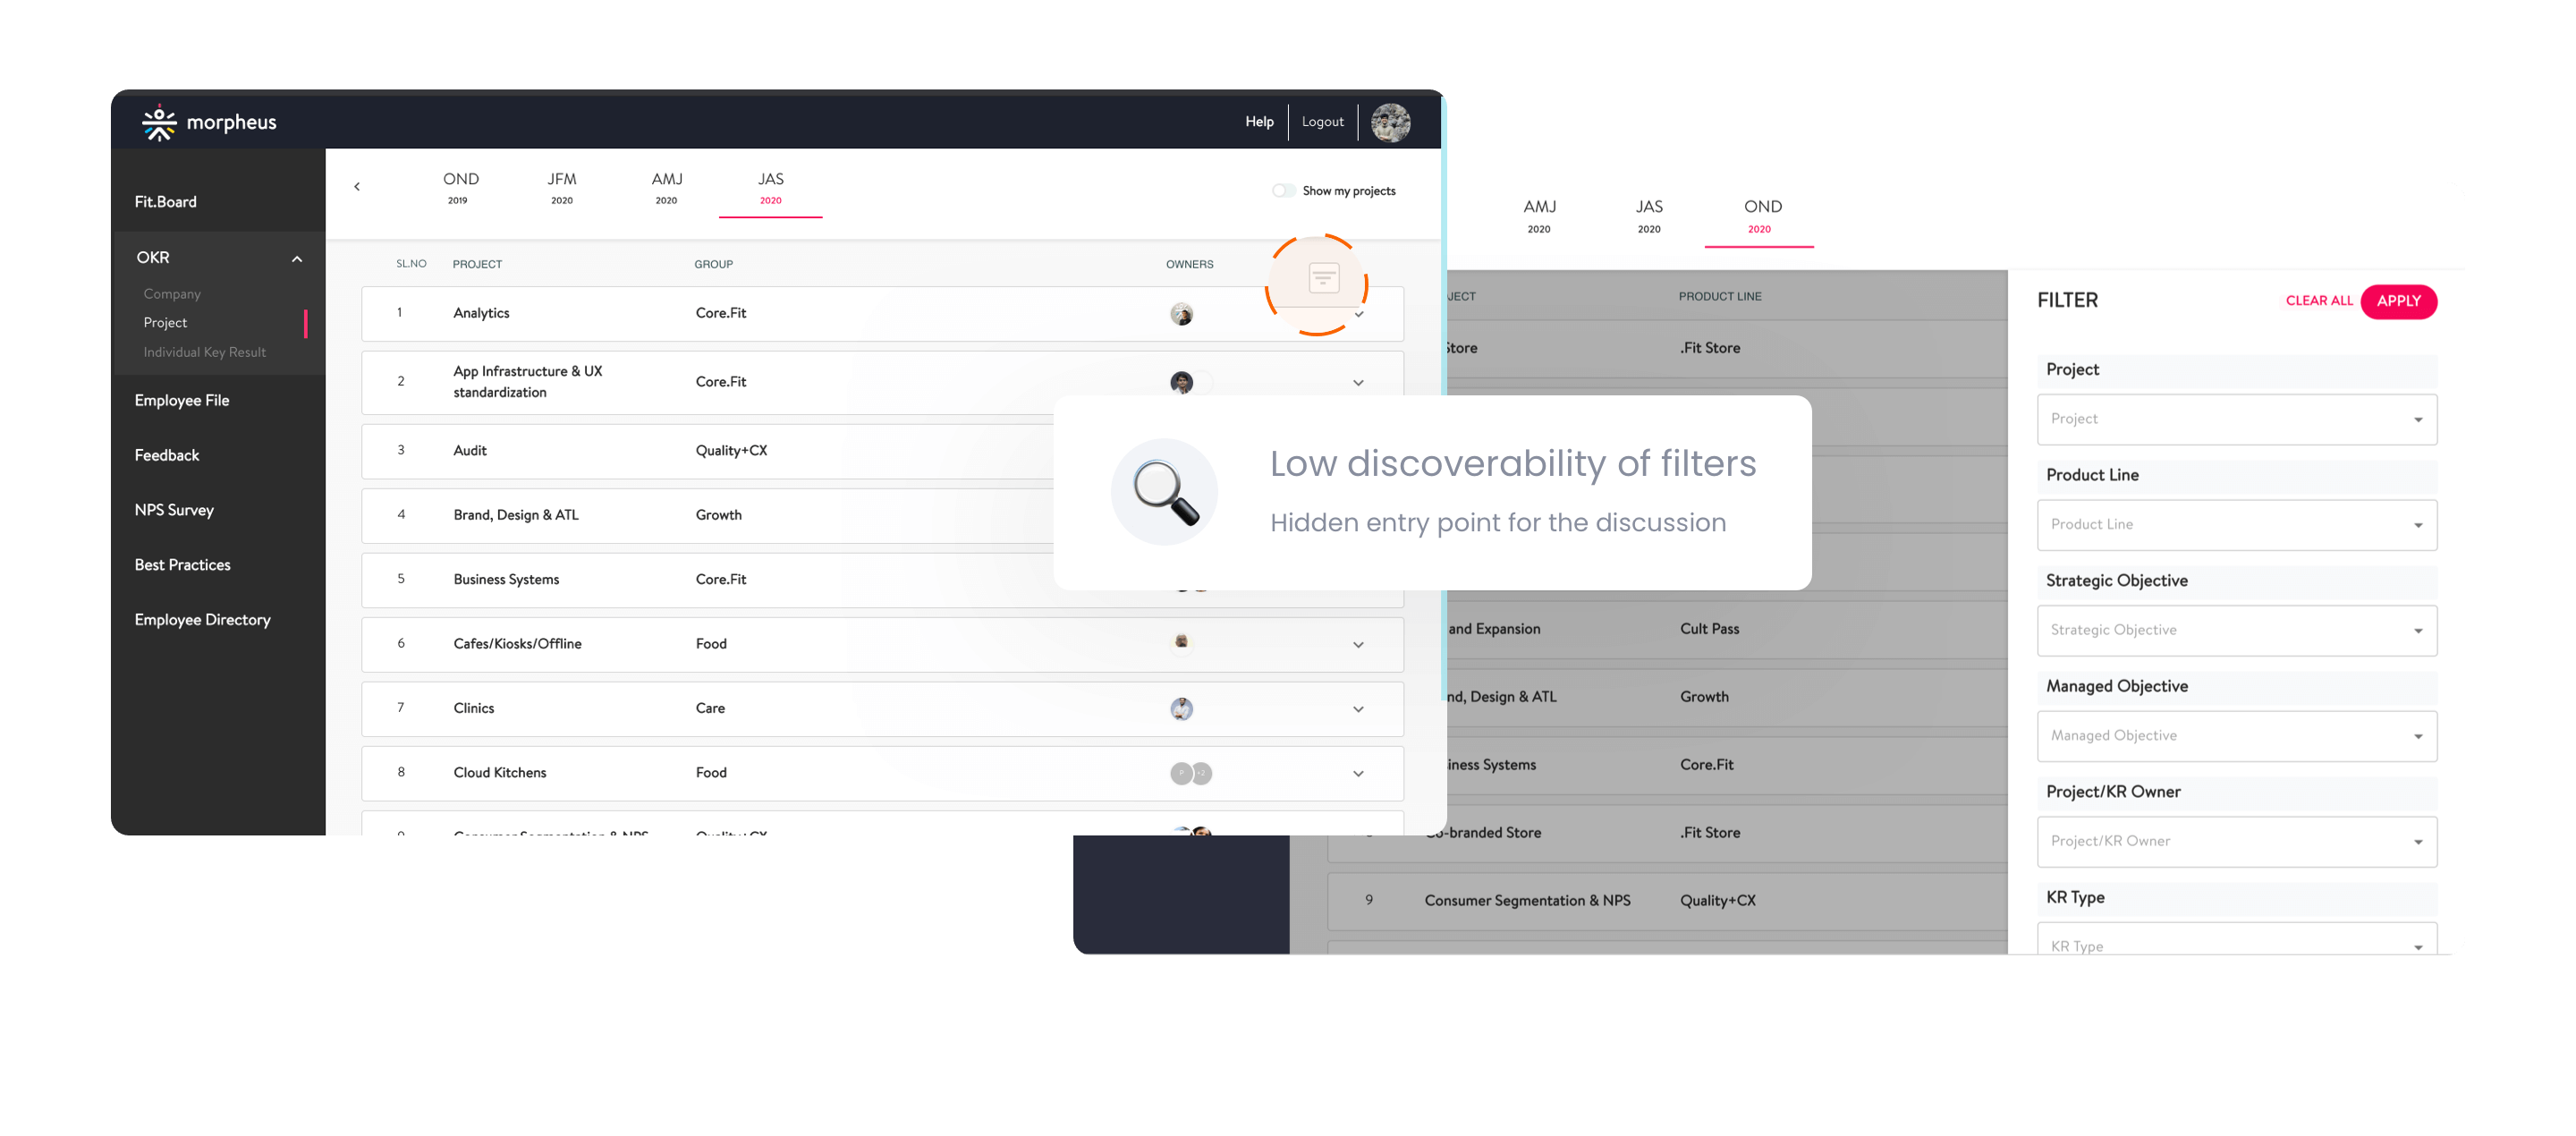
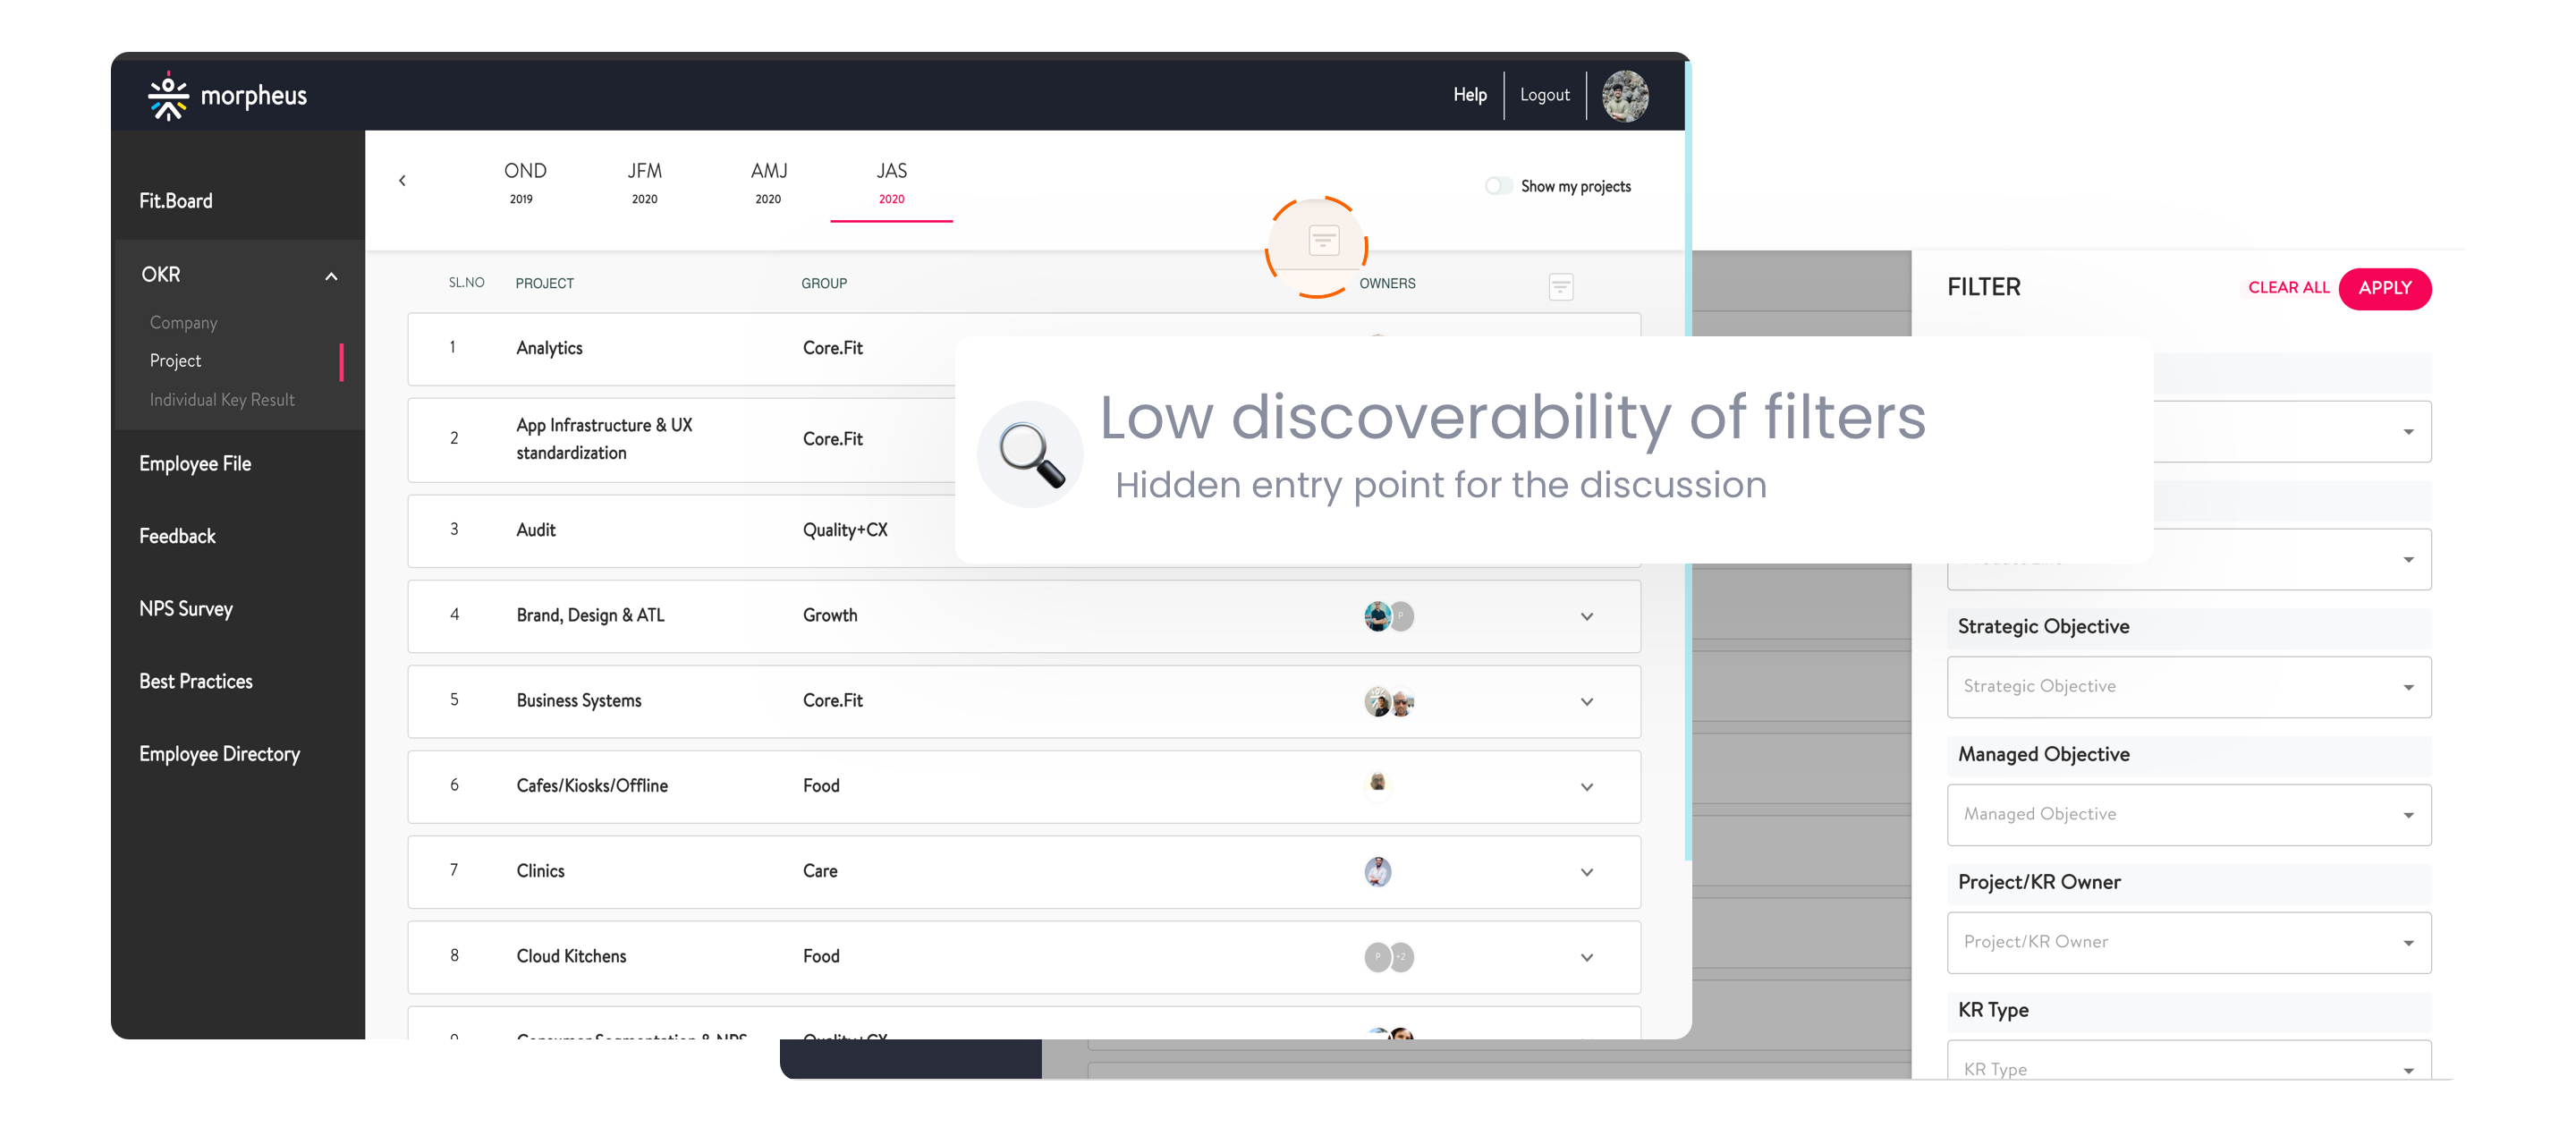
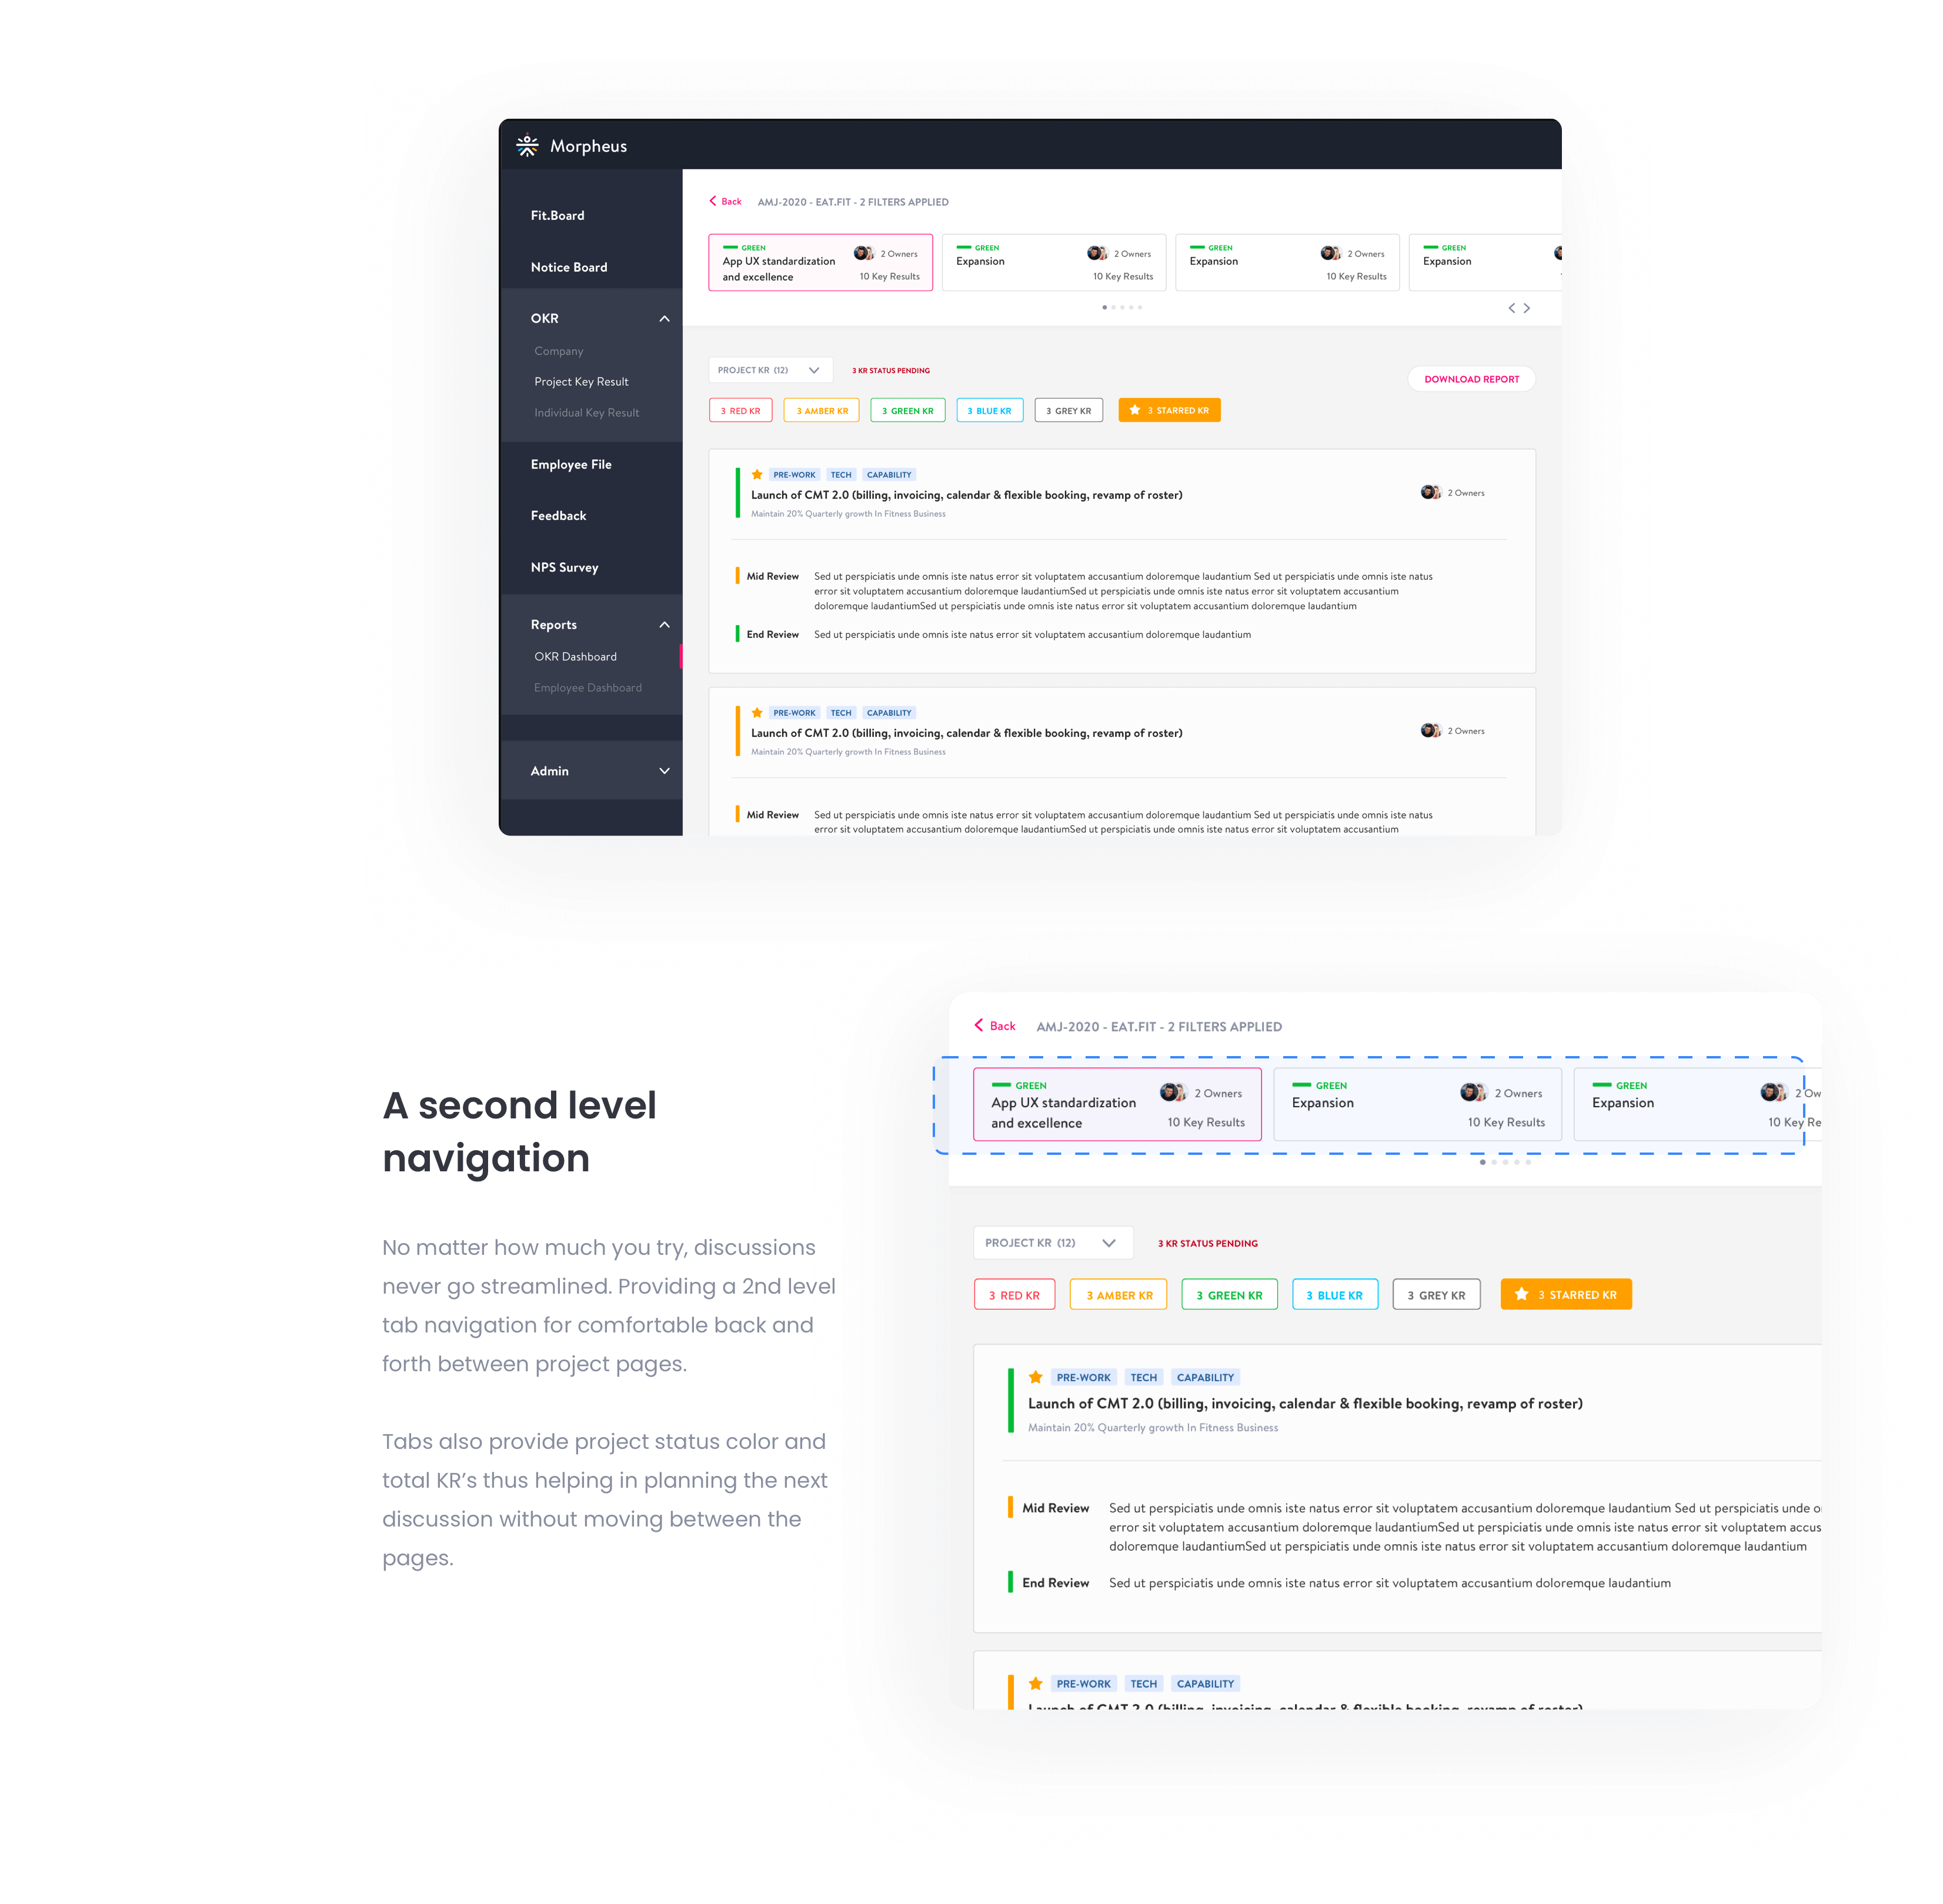
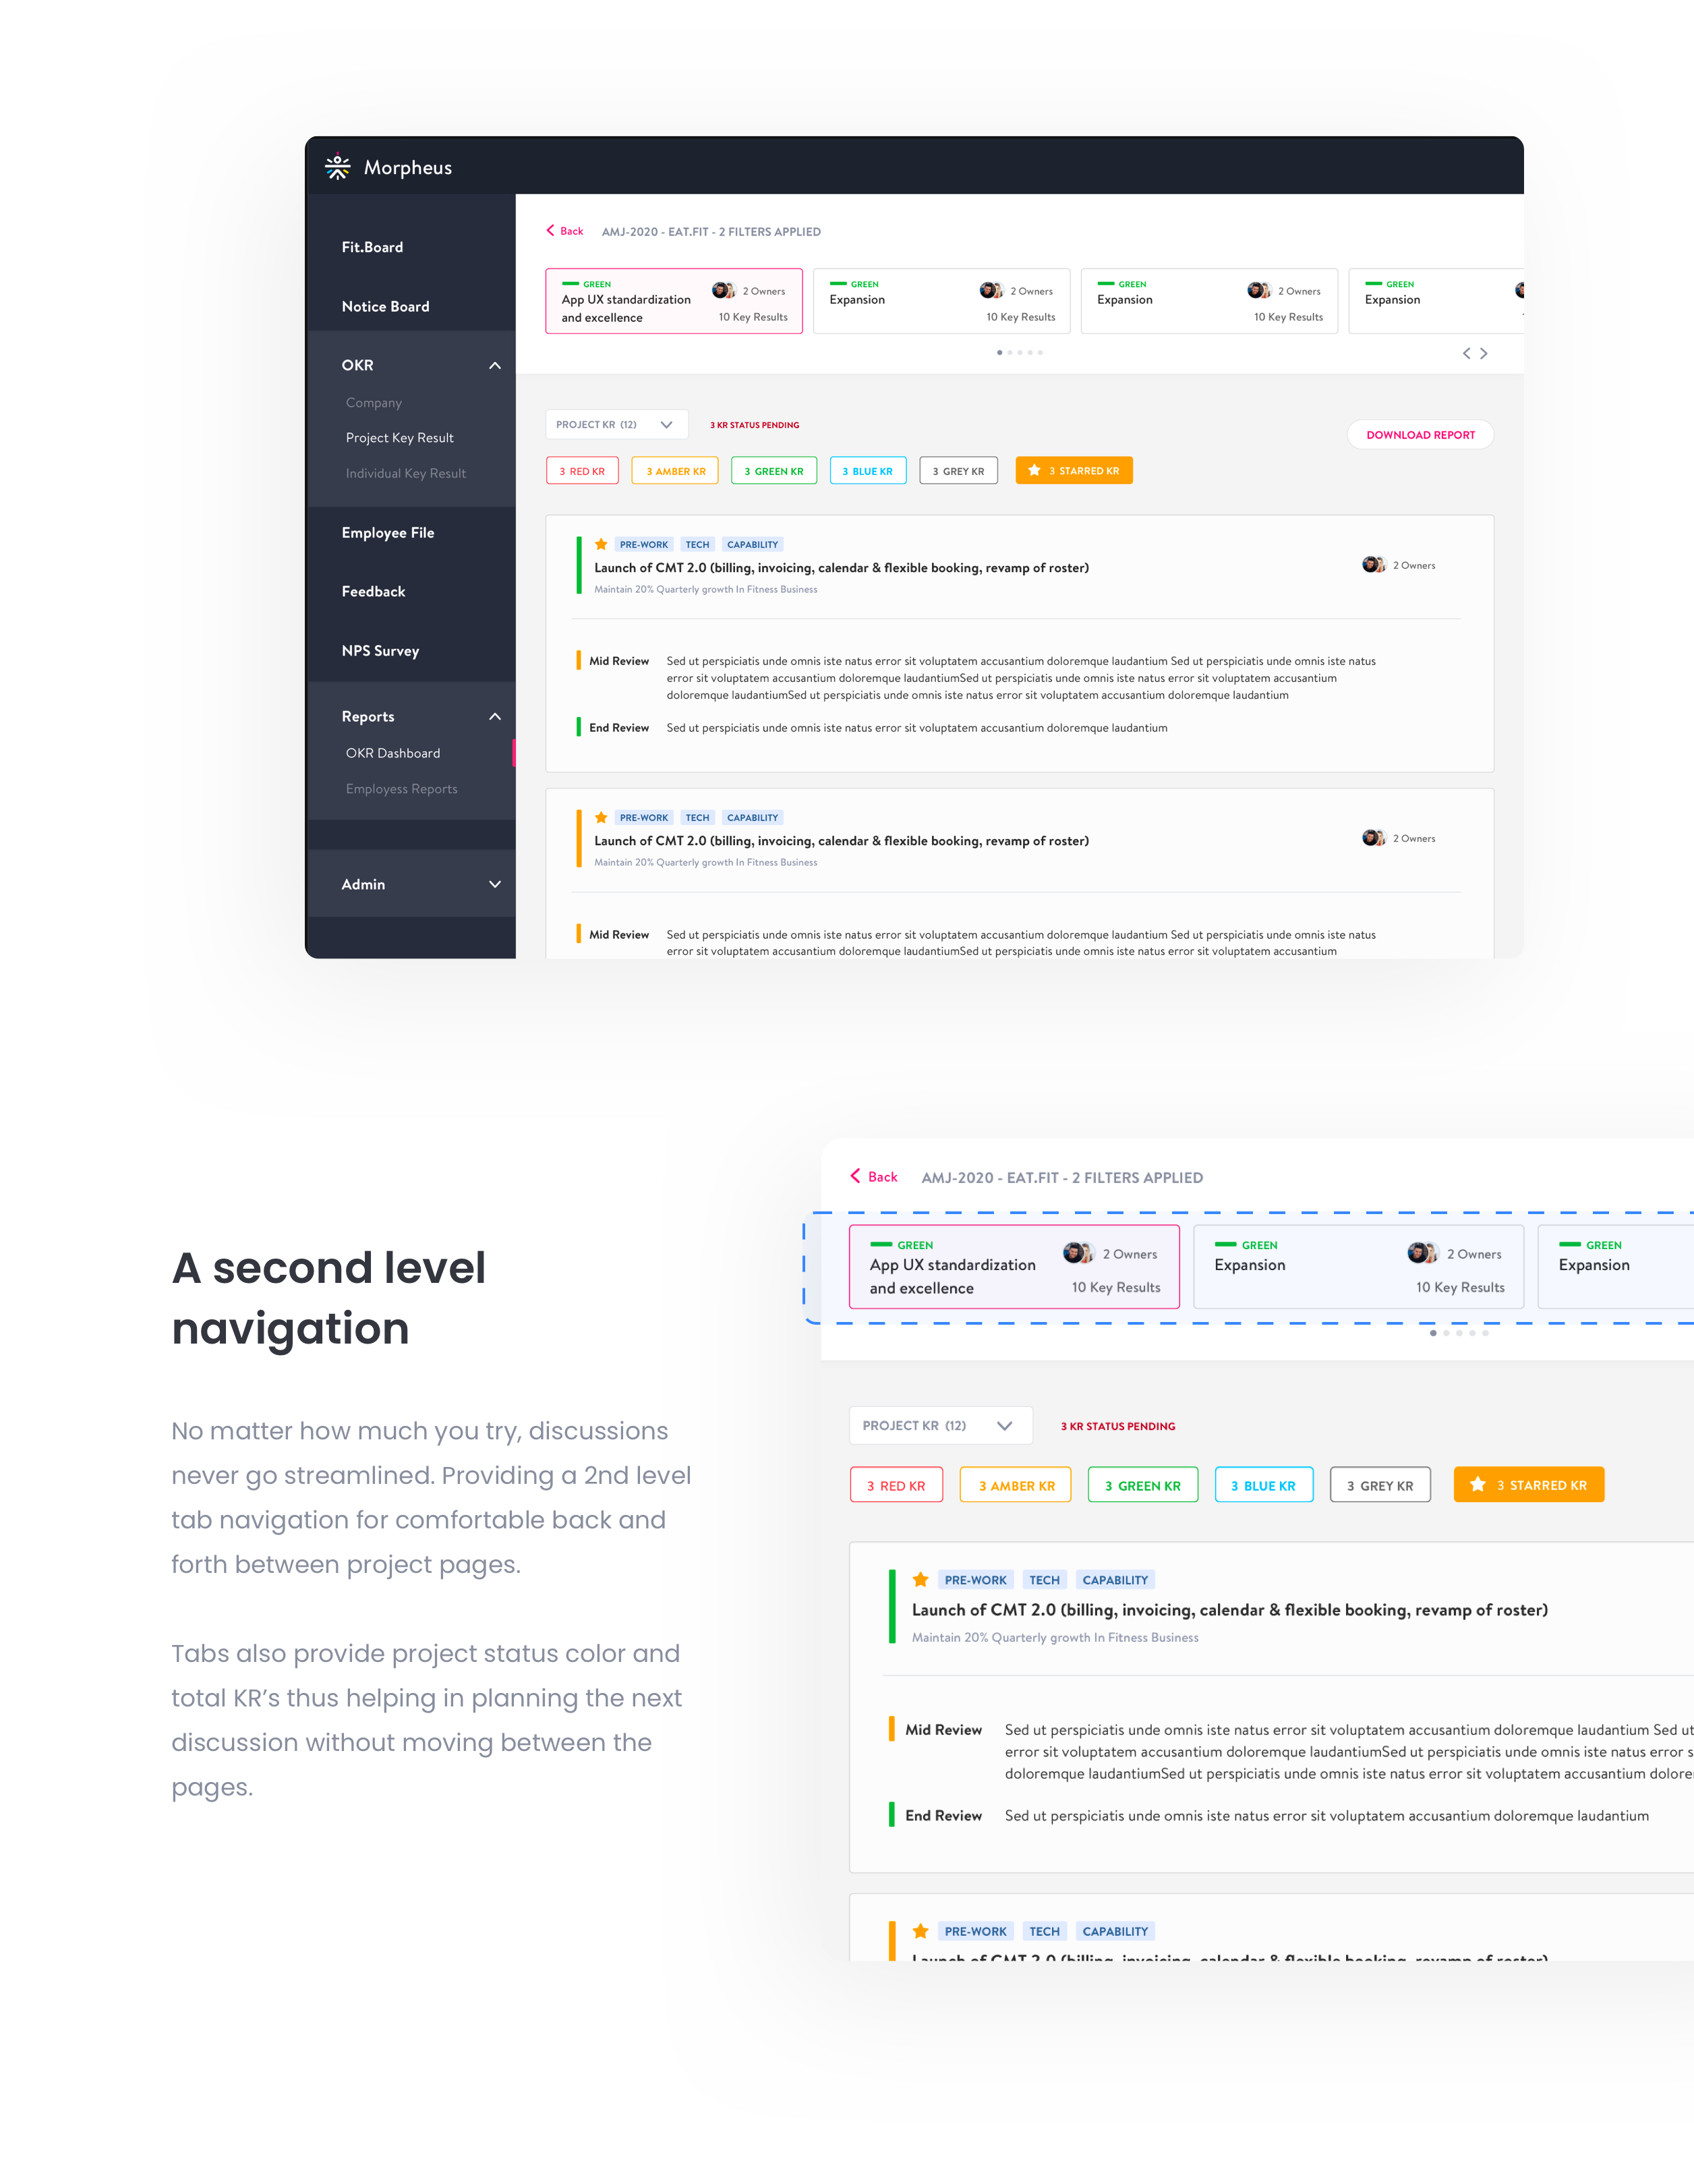
There is no way to check project KRs and individual KRs simultaneously for a project that increases a lot of difficulties as users have to keep moving back and forth between the pages.
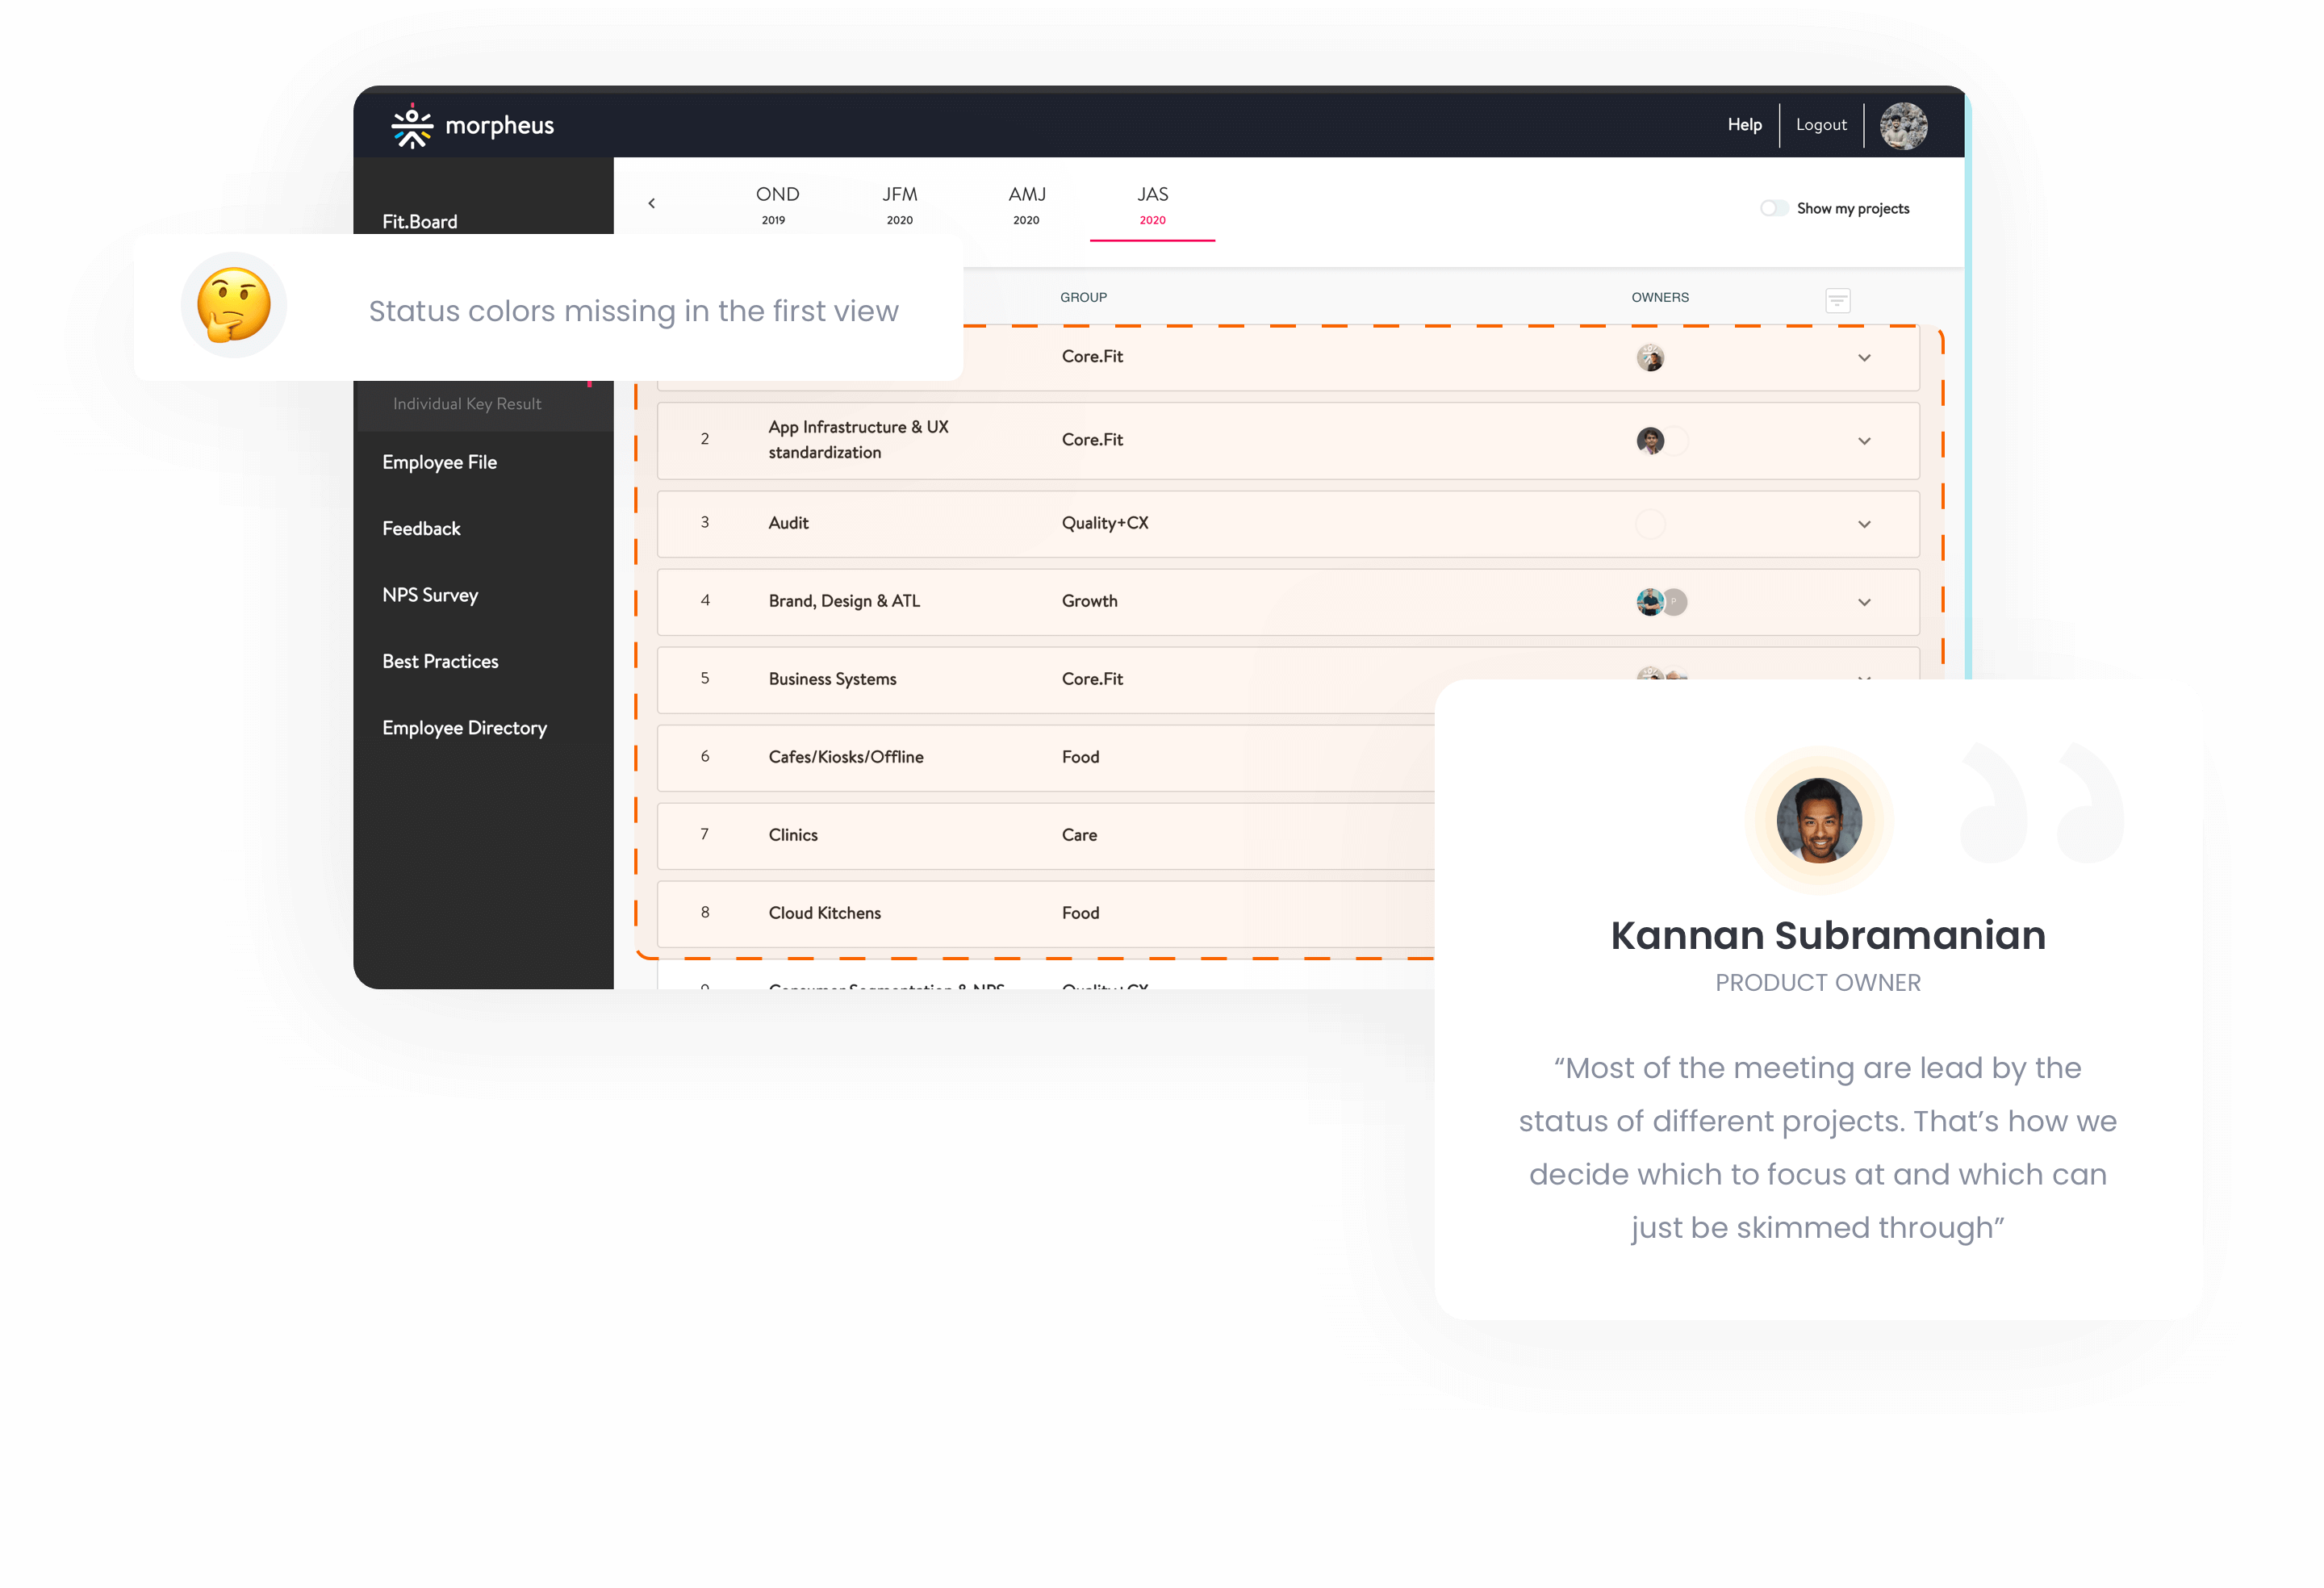
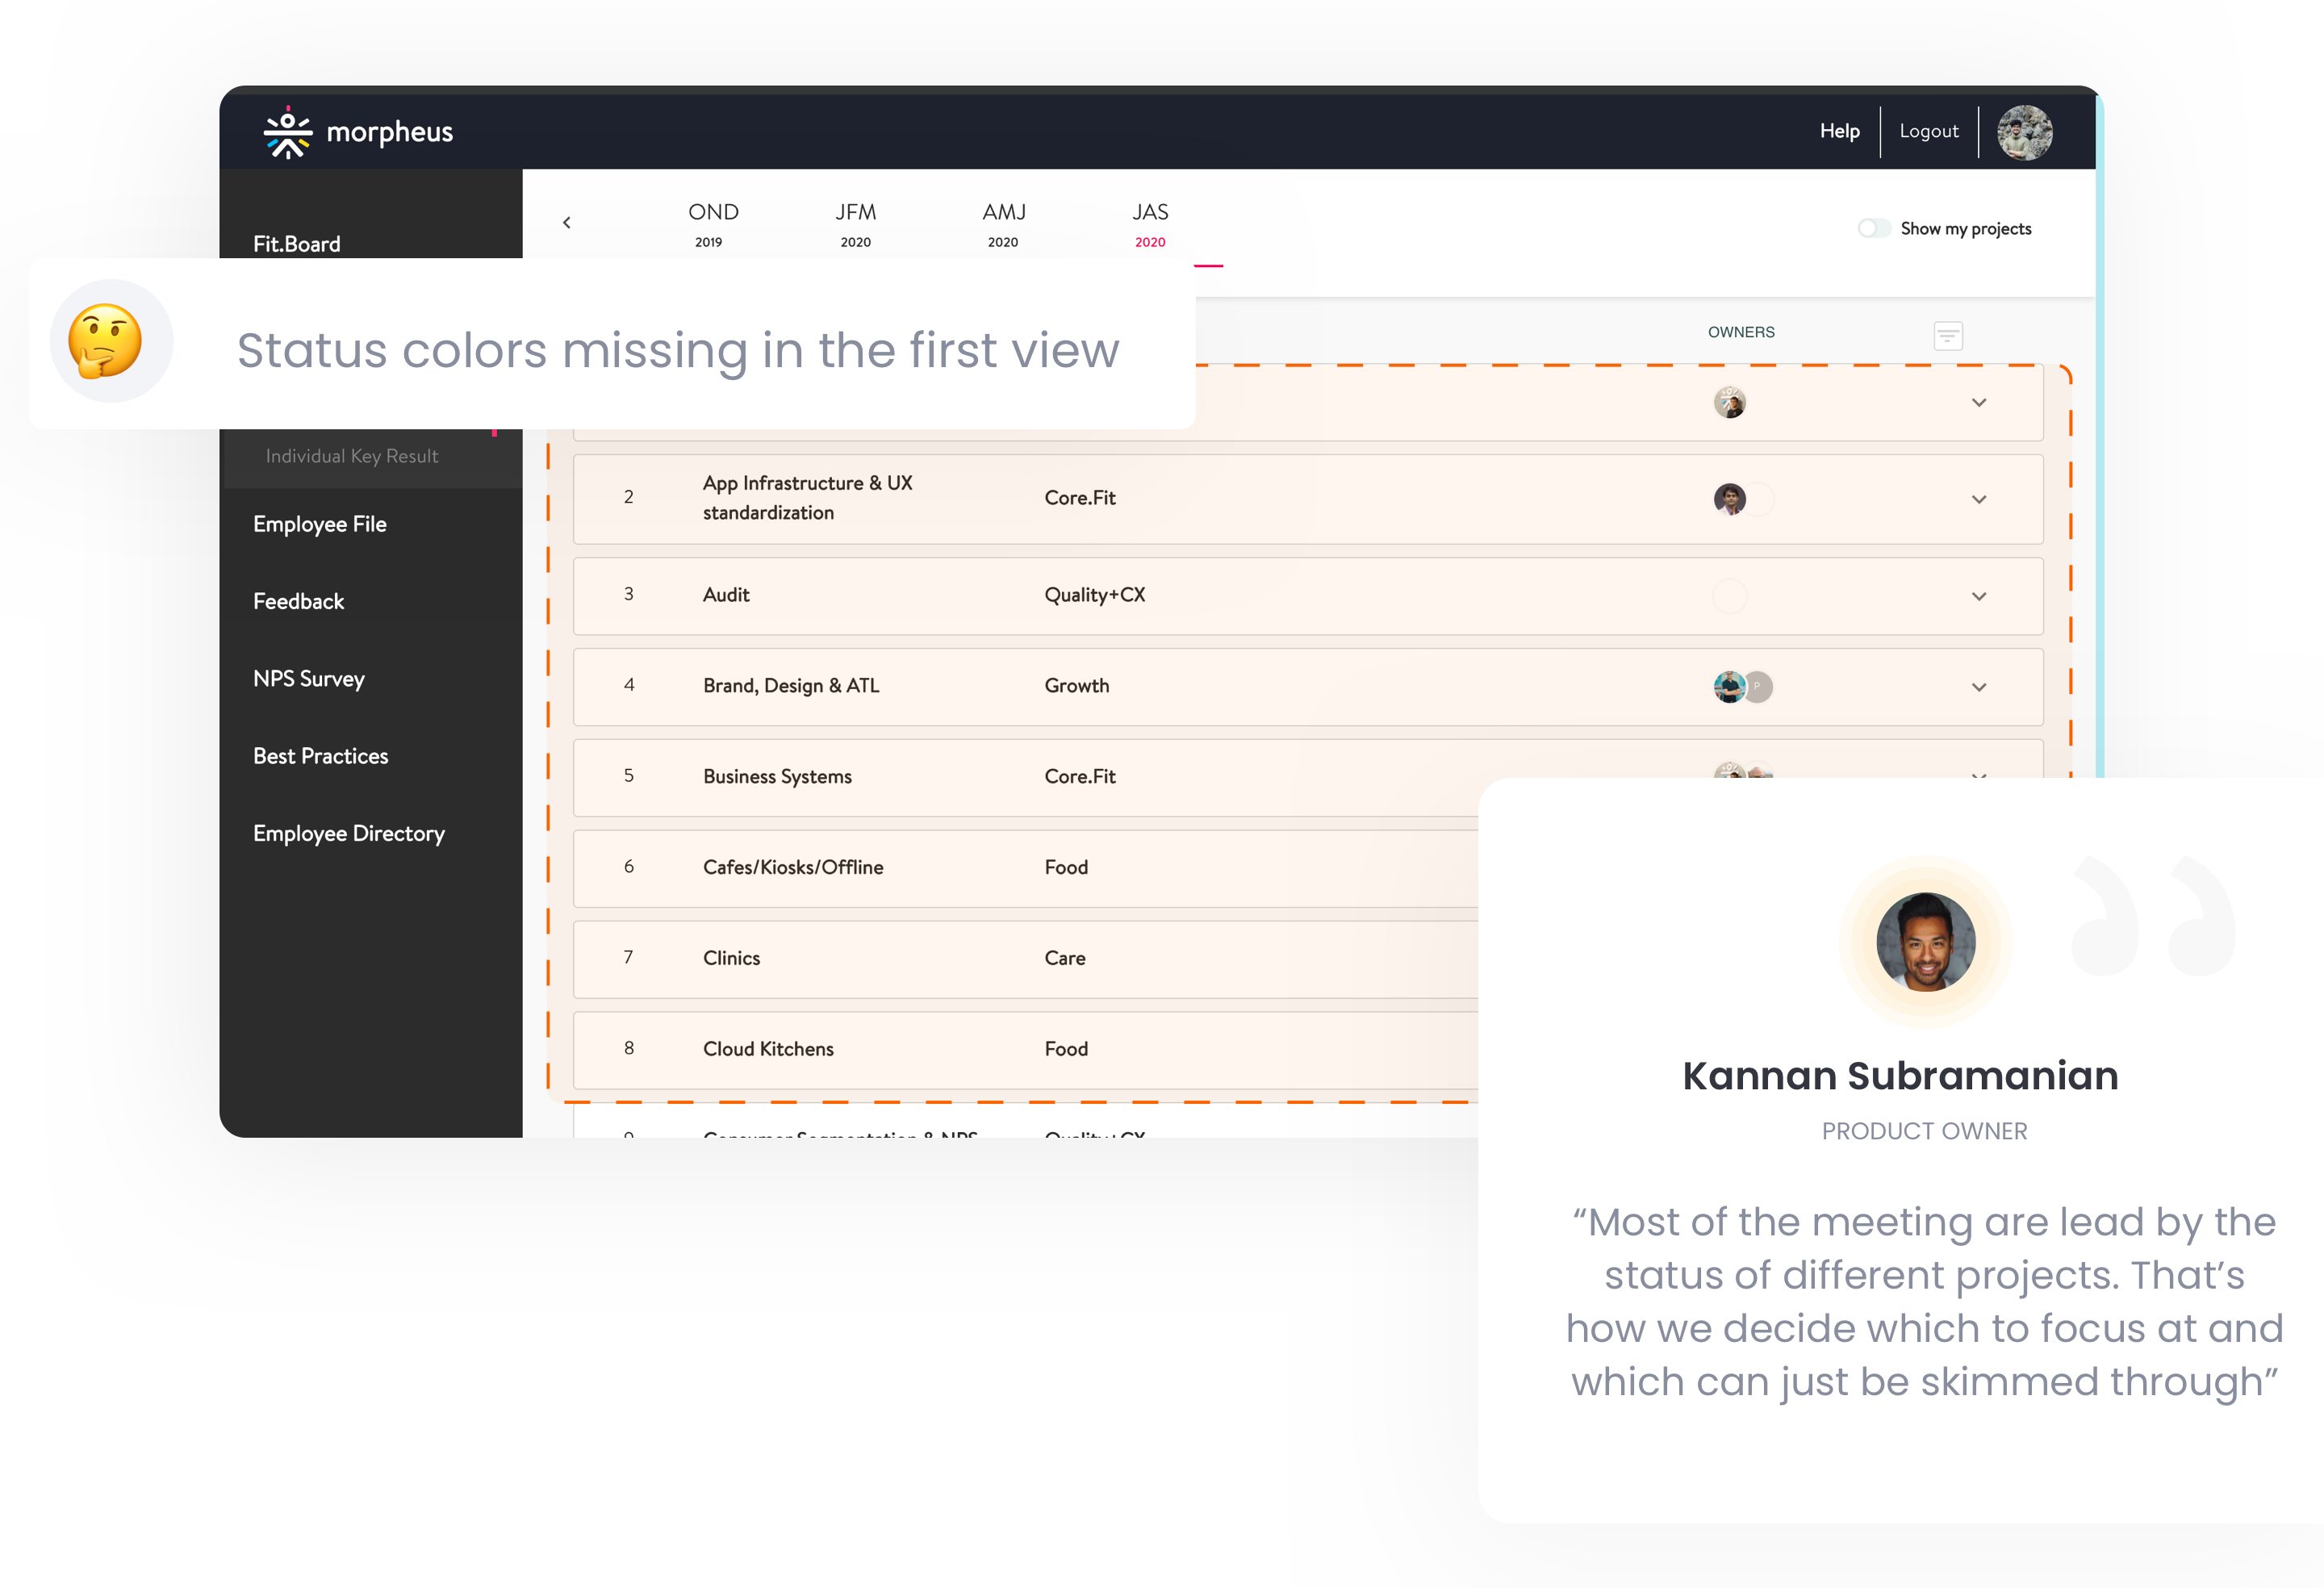
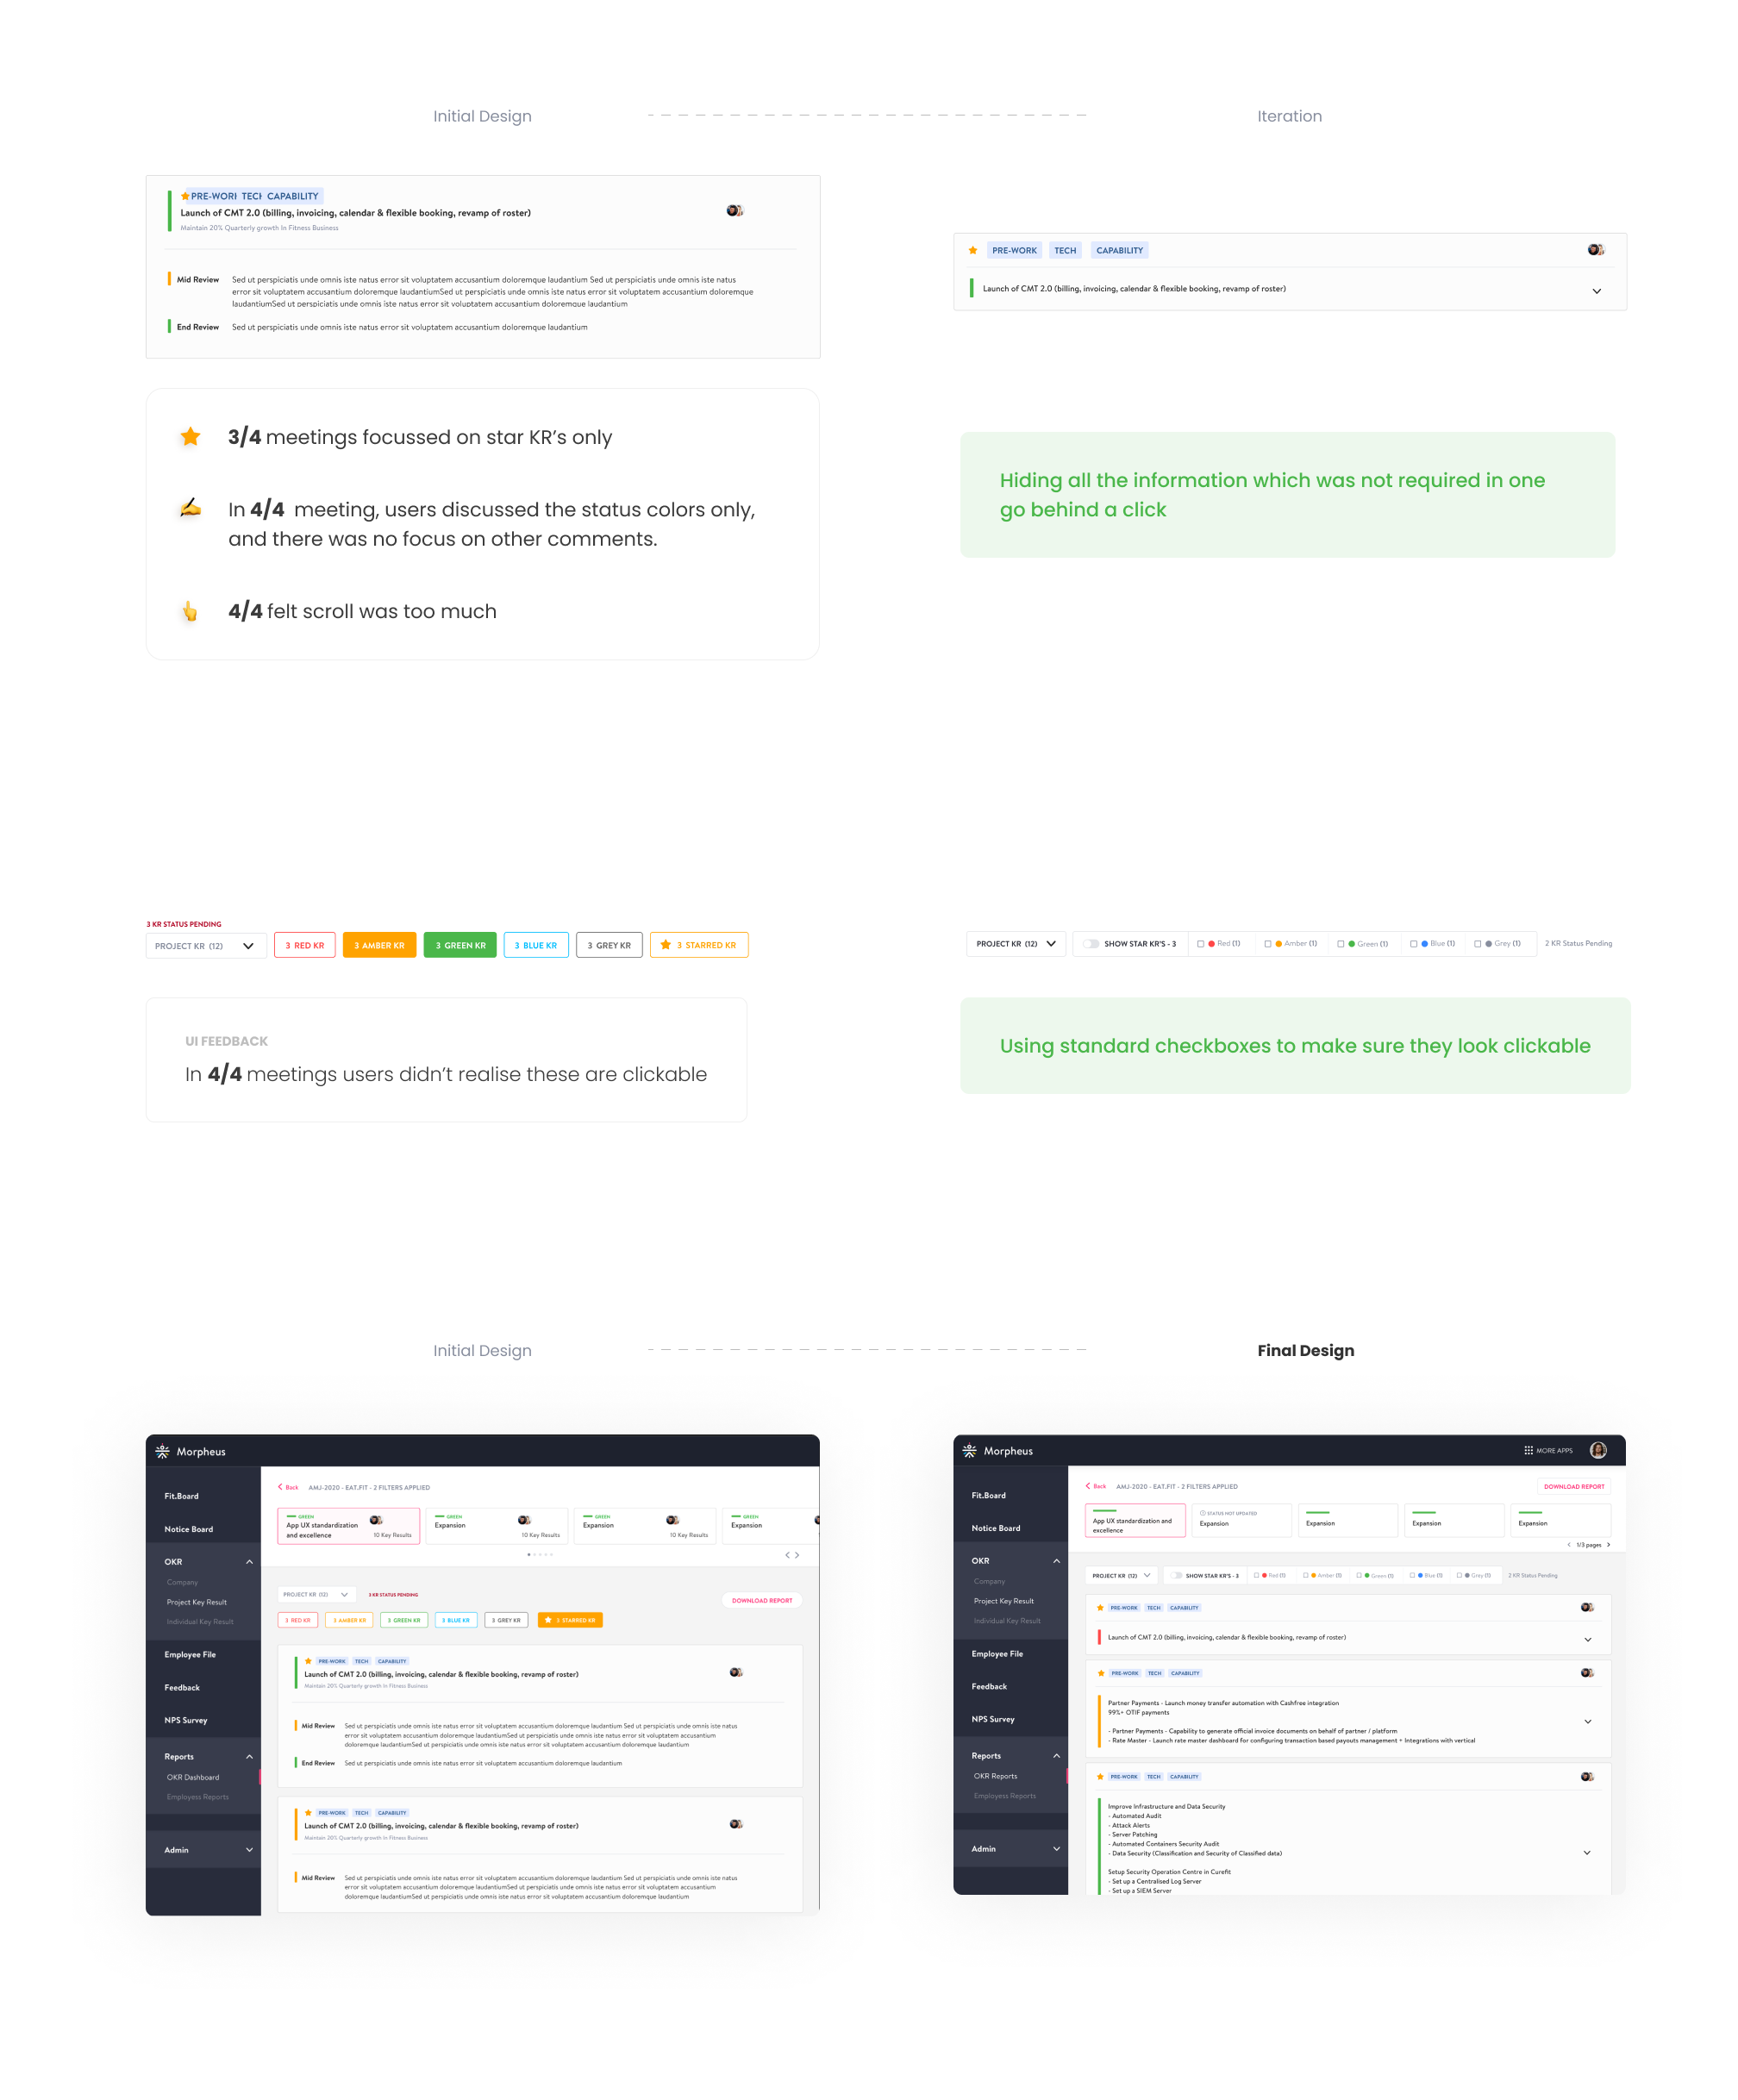
Status colors drive the complete discussion, green KRs are not discussed and just skimmed, but red and critical KRs are discussed in depth to understand what went wrong and what needs to be done now.
Difficulty in consuming data due to fragmented information and actions. These are essential for managing the OKRs but not required during the quarterly discussion.
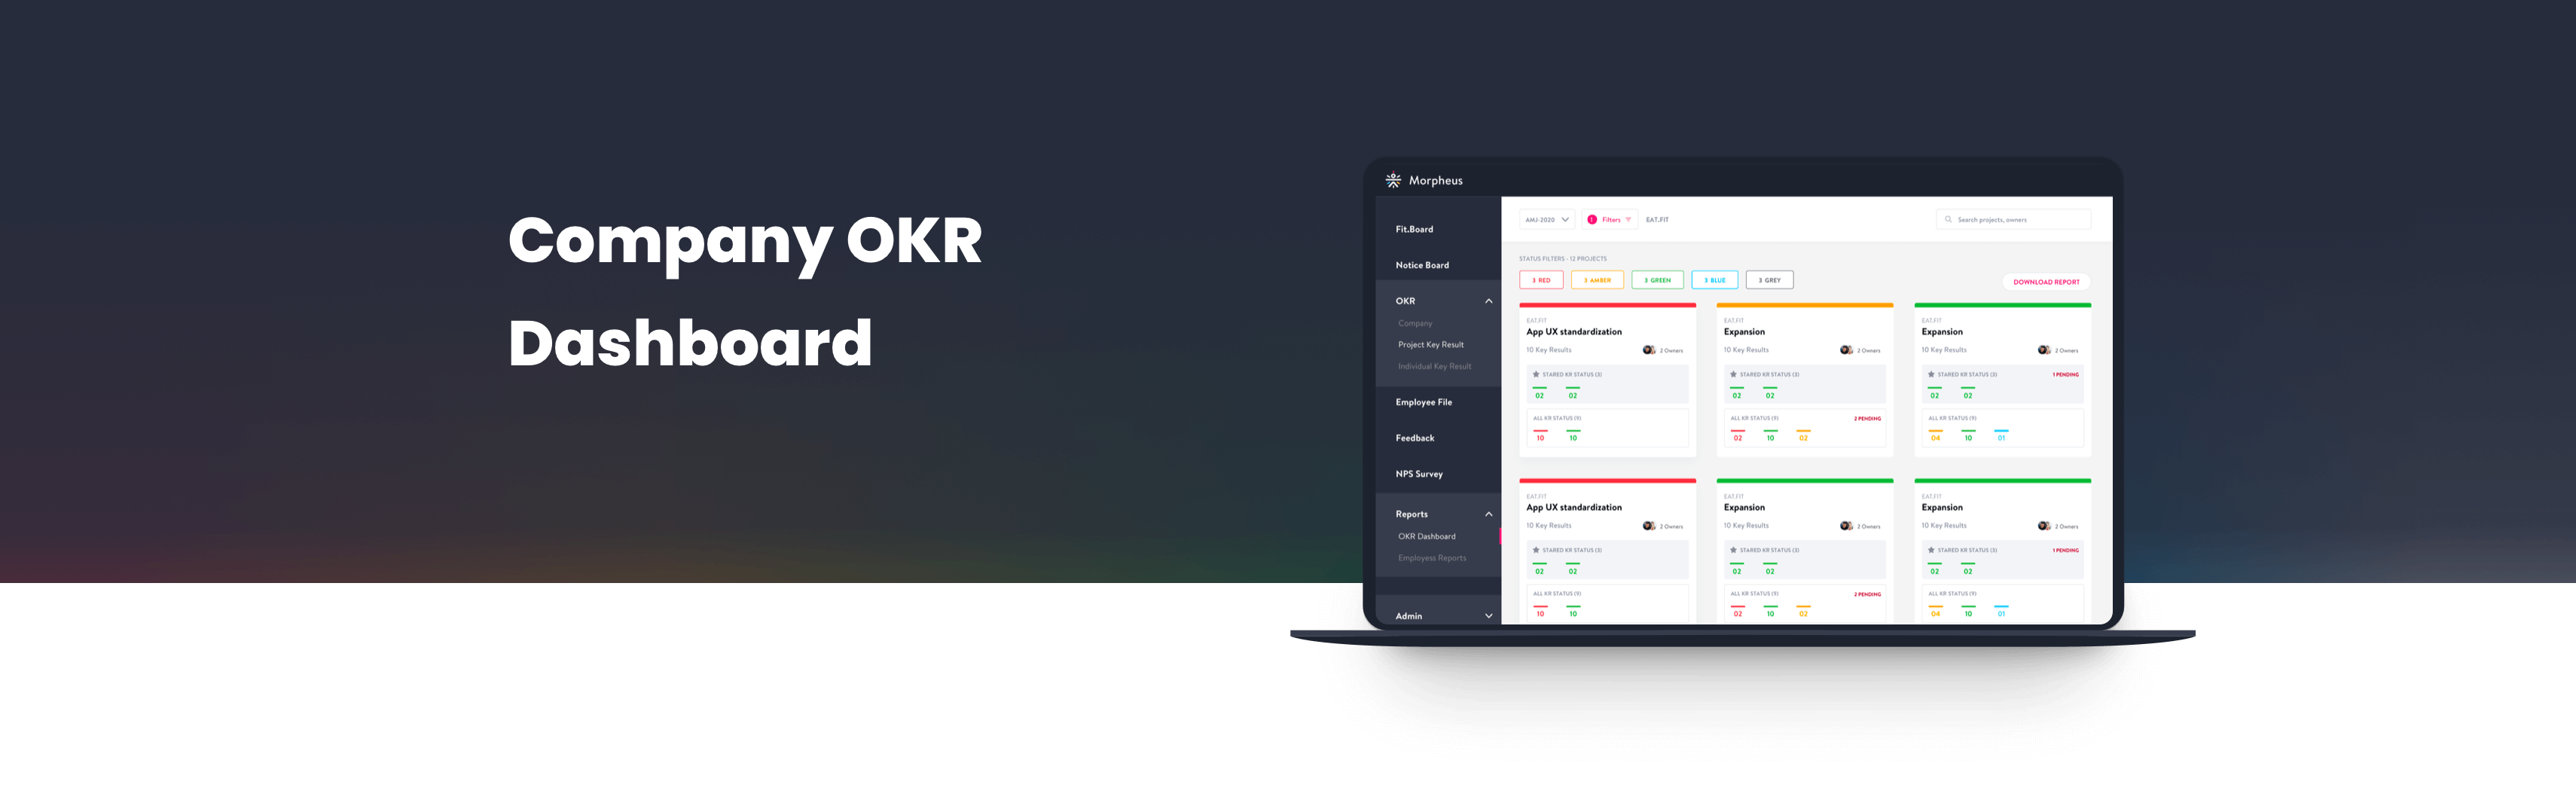
1. Easy way to check all essential Projects and KR statuses without fighting with a lot of other information and actions. A better alternative of the management view and google sheets
2. Keeping the status colors as the primary carrier of the discussion to avoid any deviation.
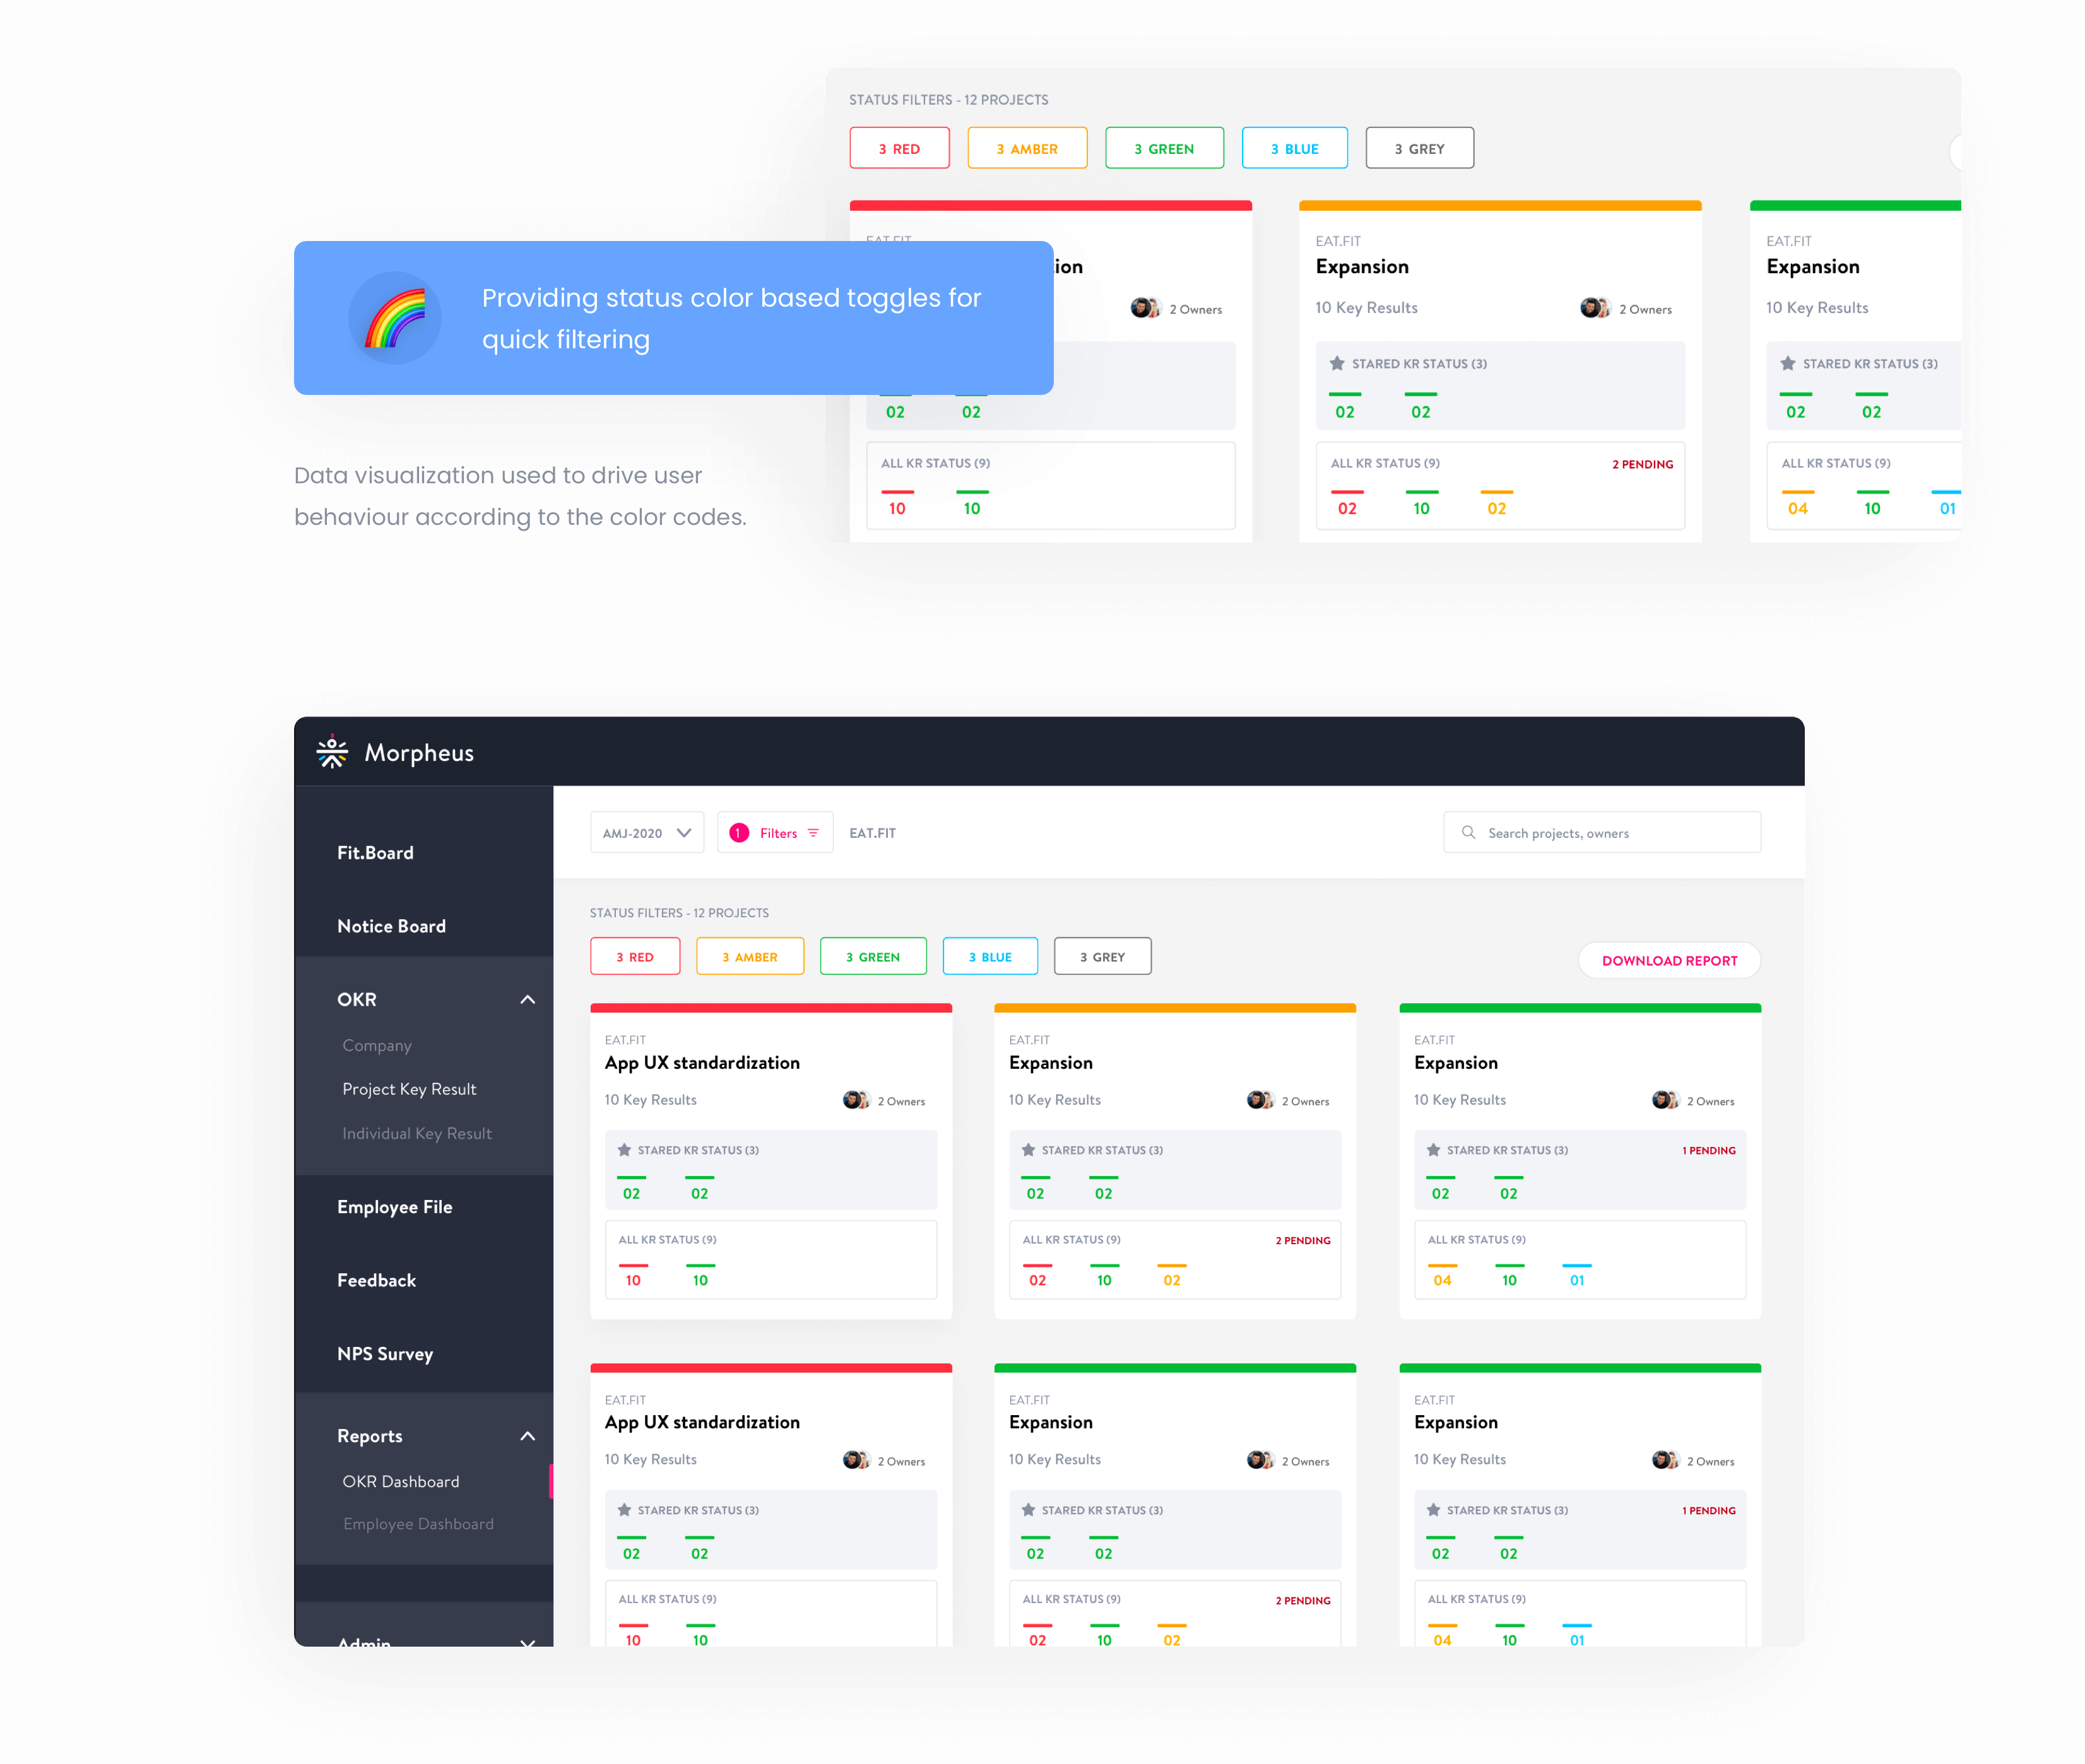
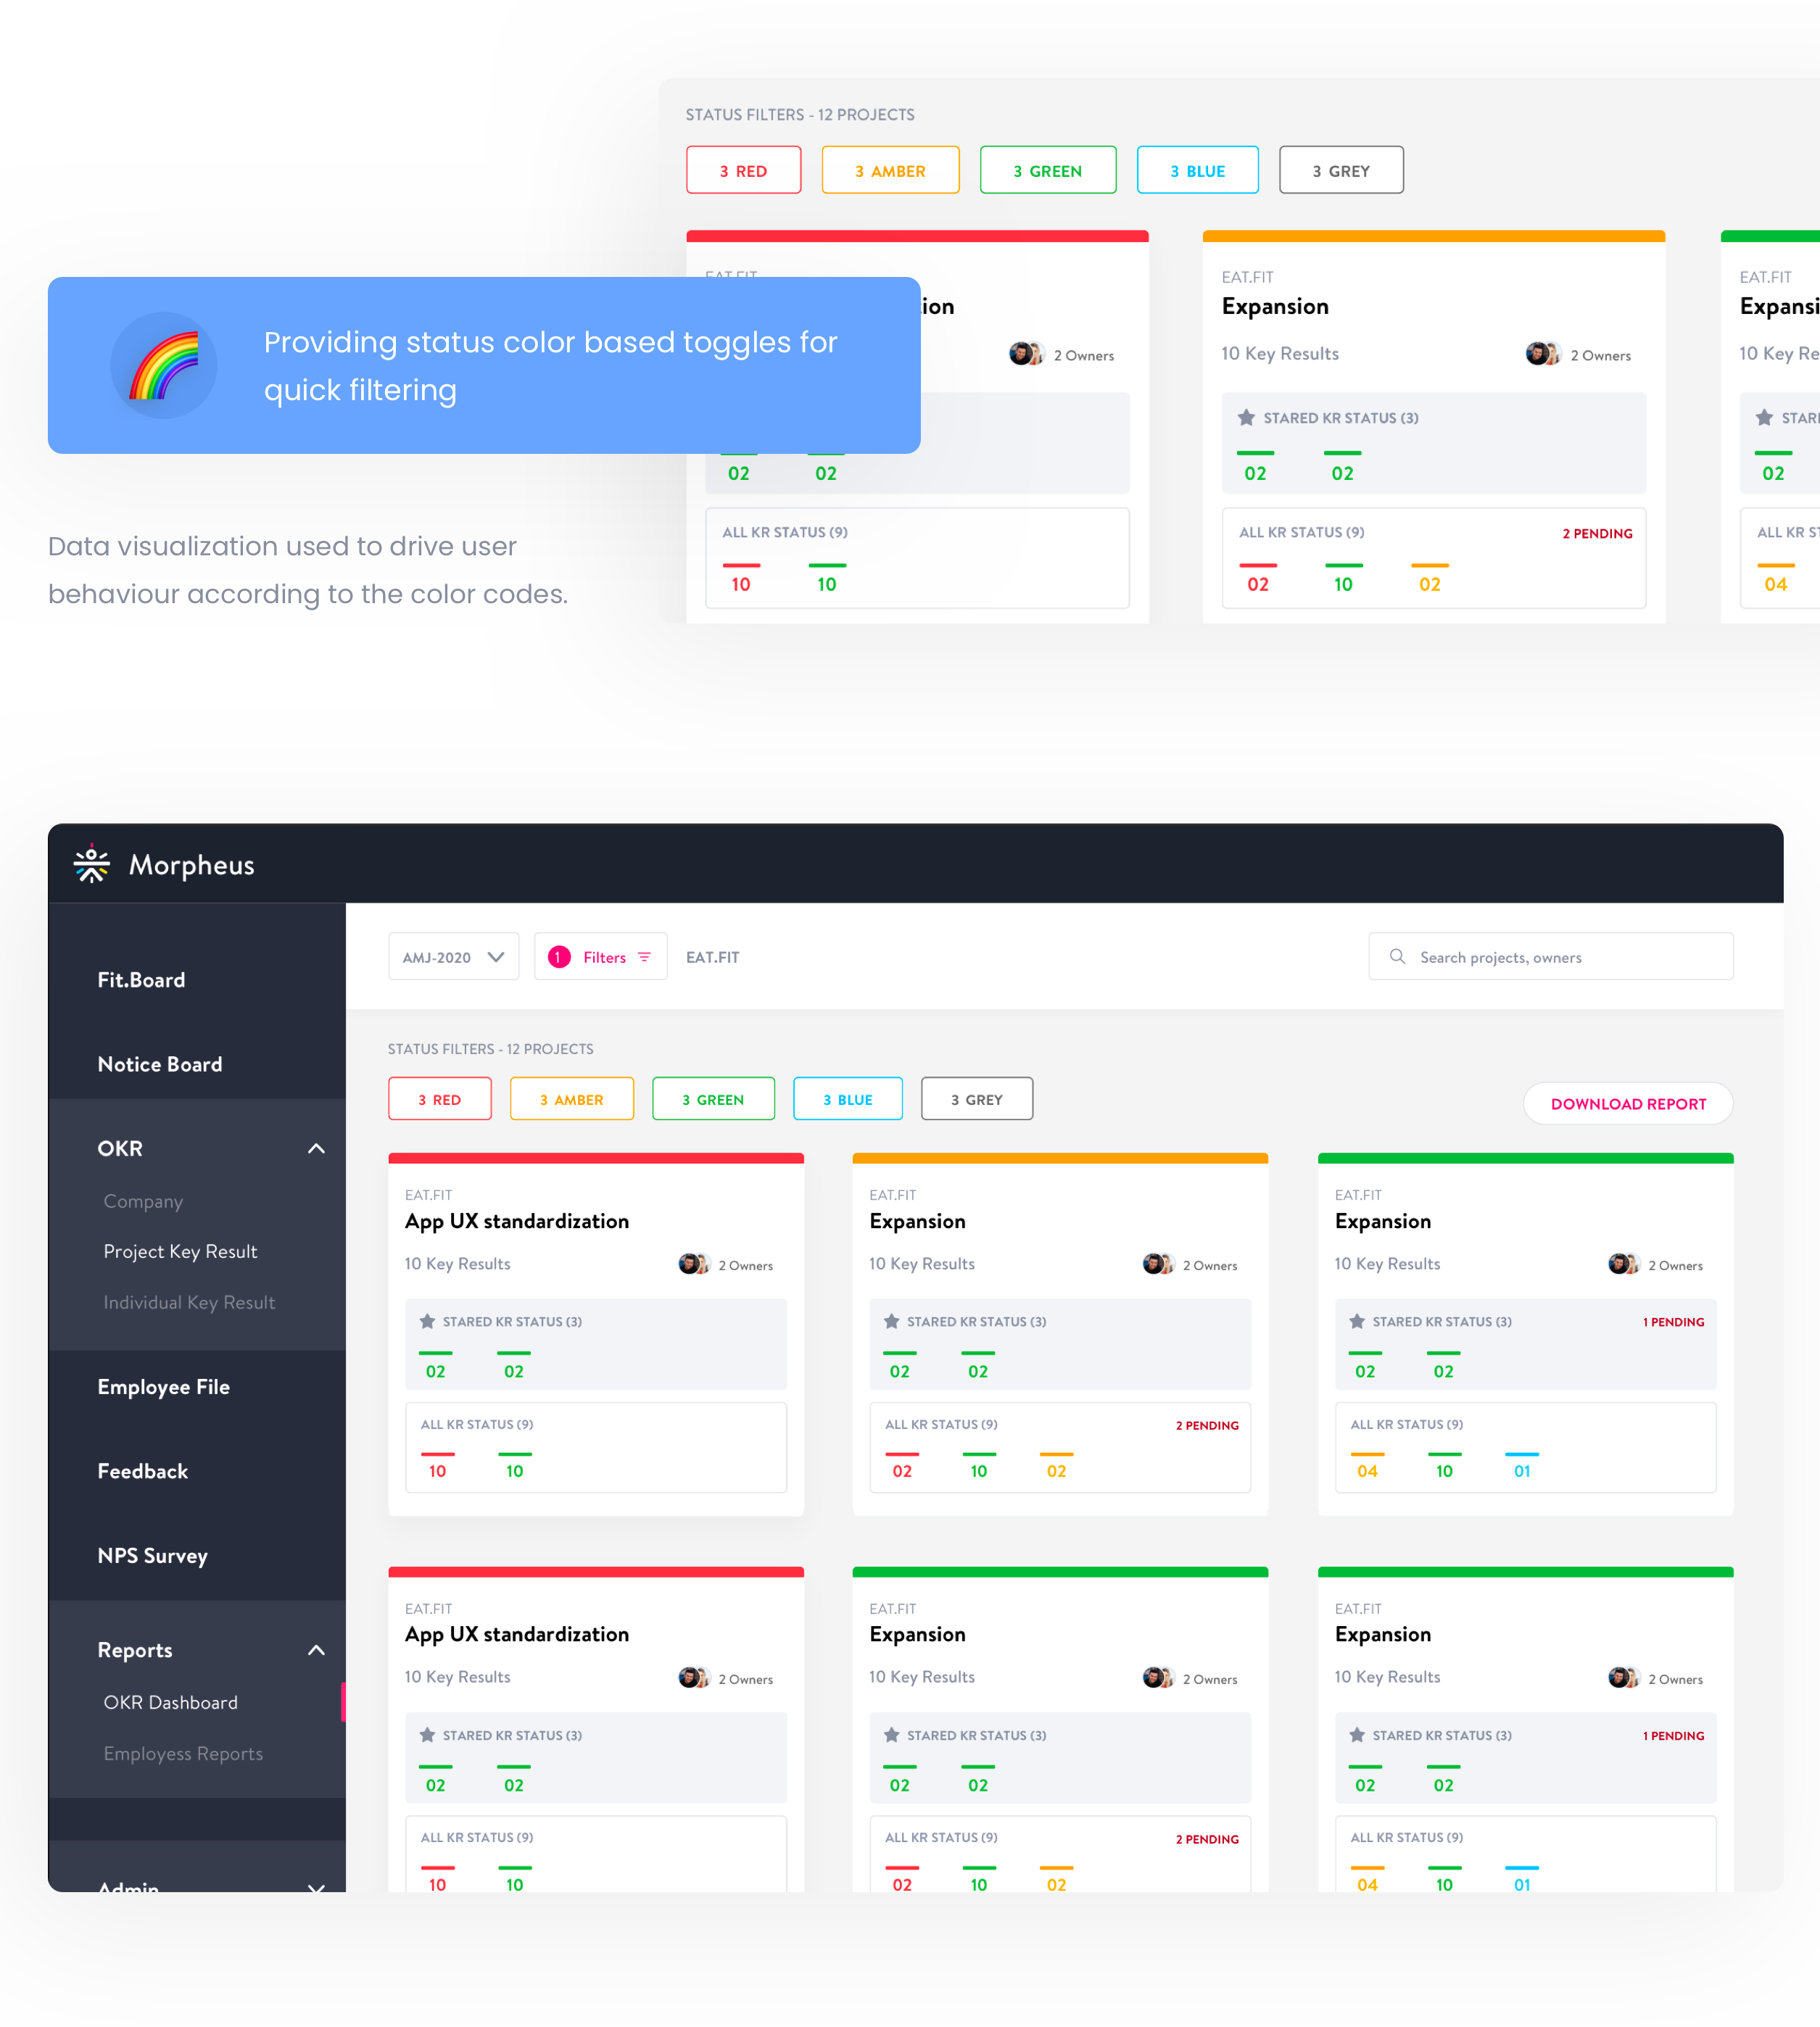
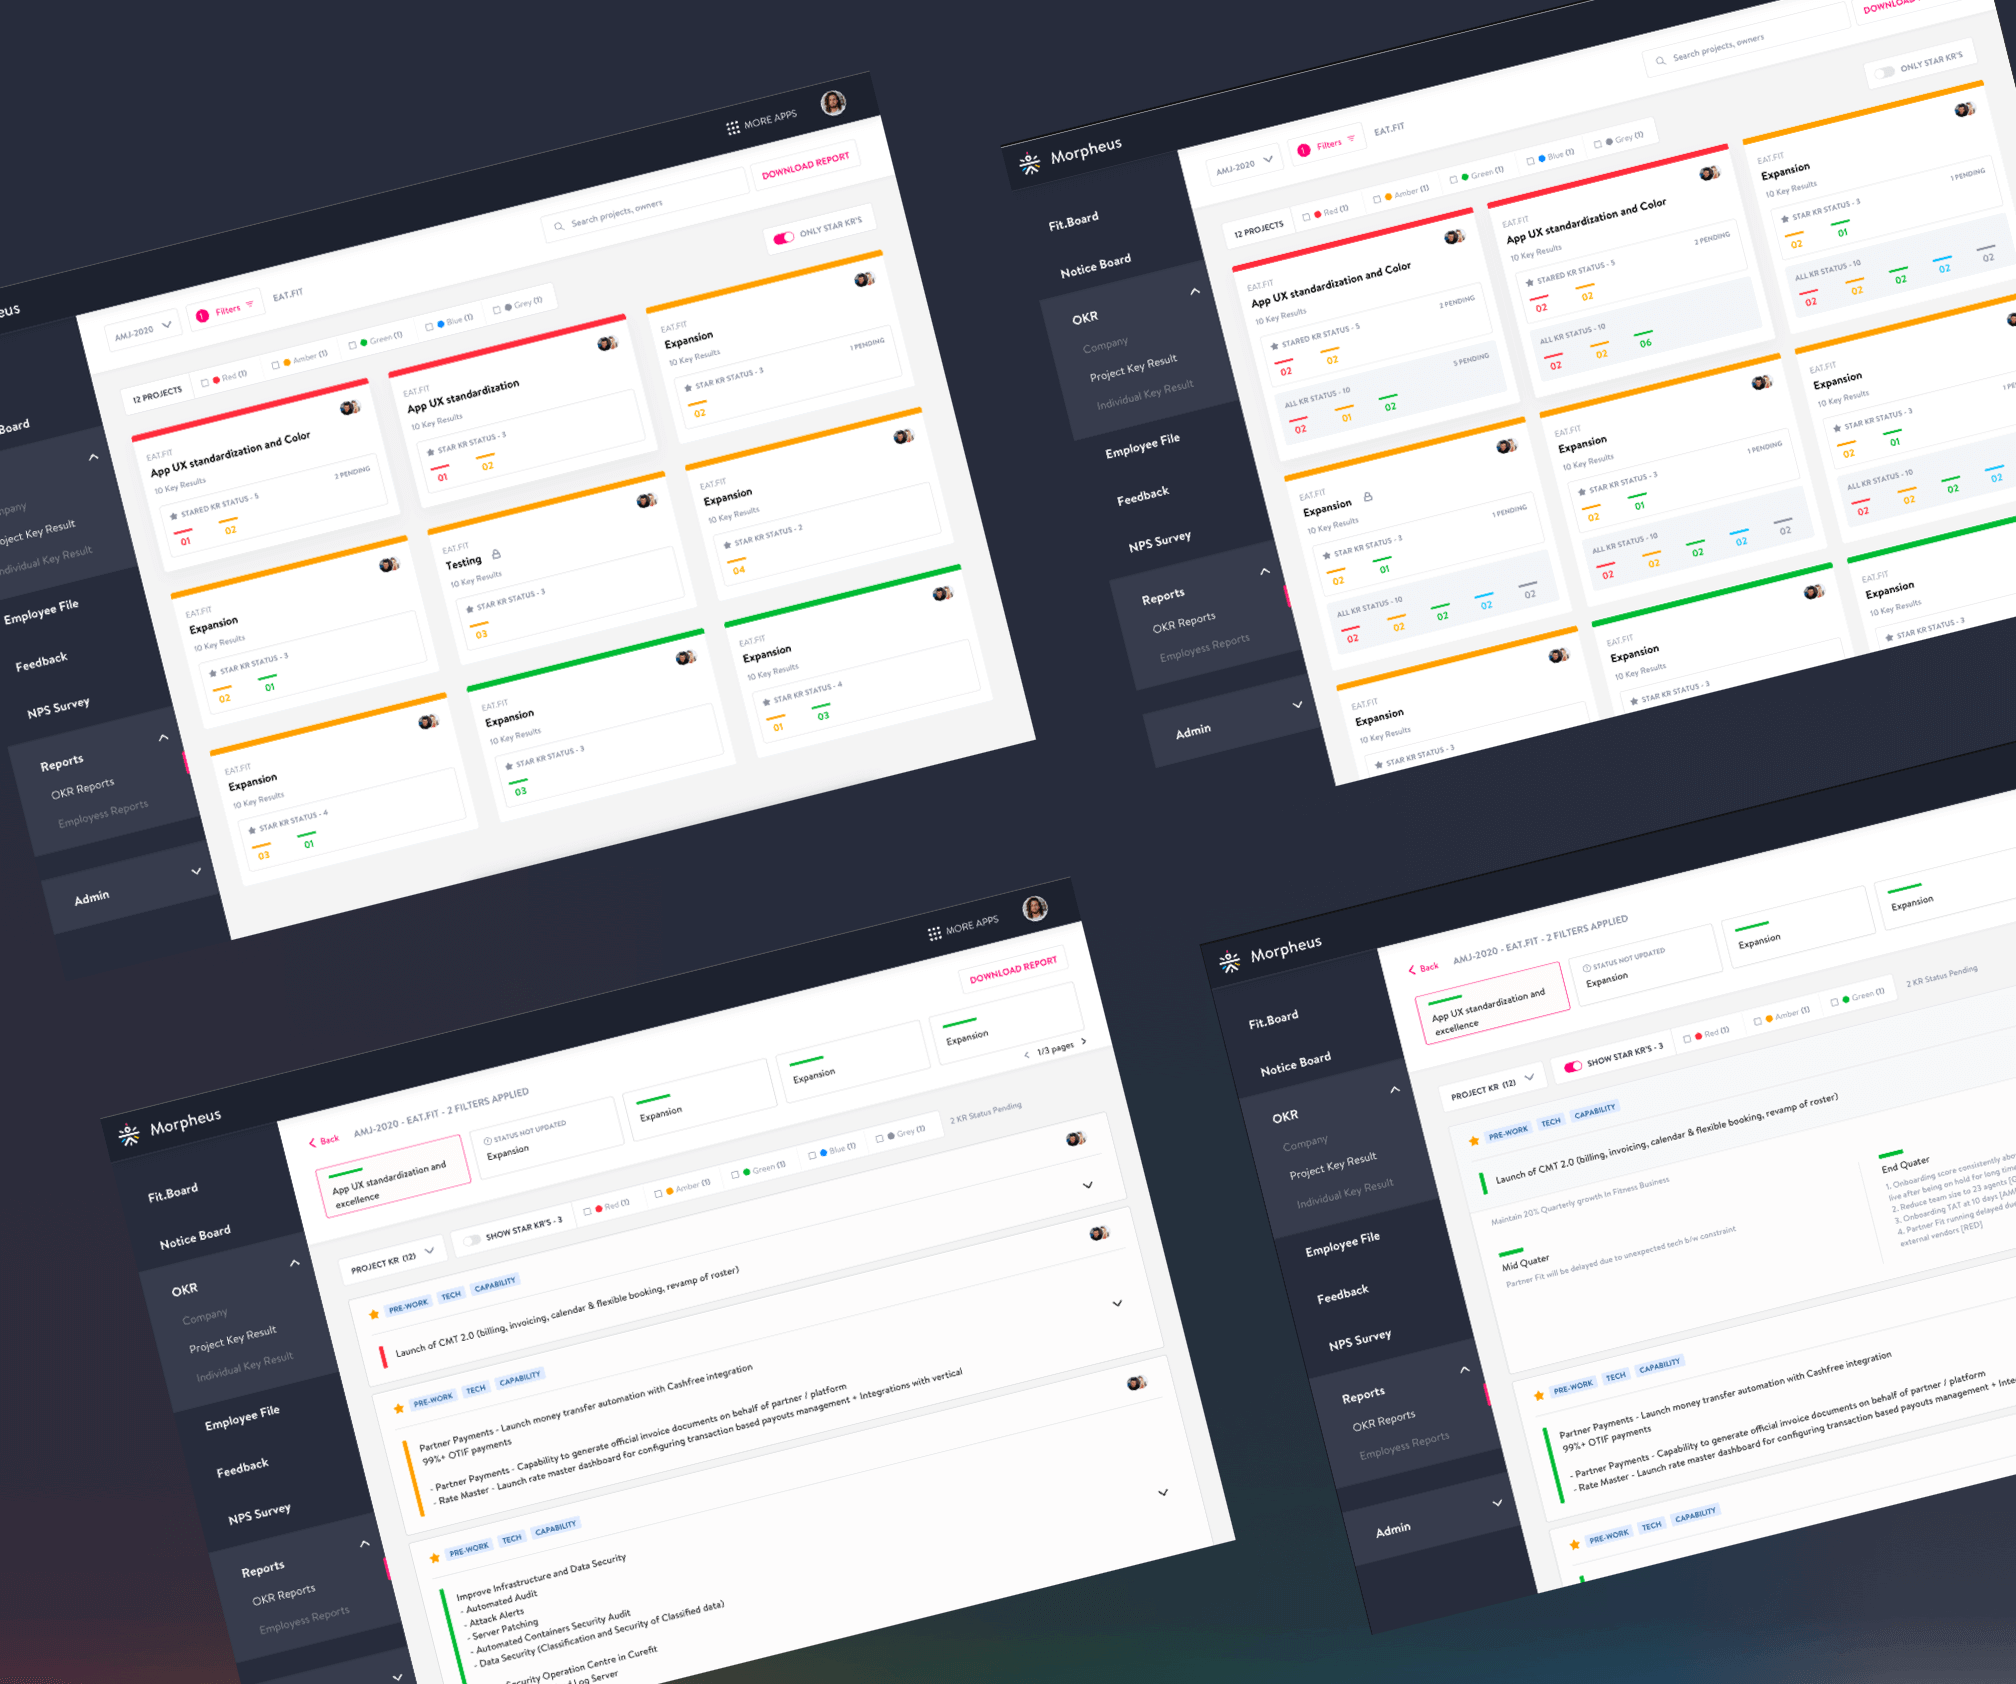
Using data visualization to provide better navigation through the projects and KR’s for all OKR related discussions and meetings, taking OKR status as a primary deciding and discussion factor.
Future Scope:Adding more and more data visualization tools to gain more insights with less effort.
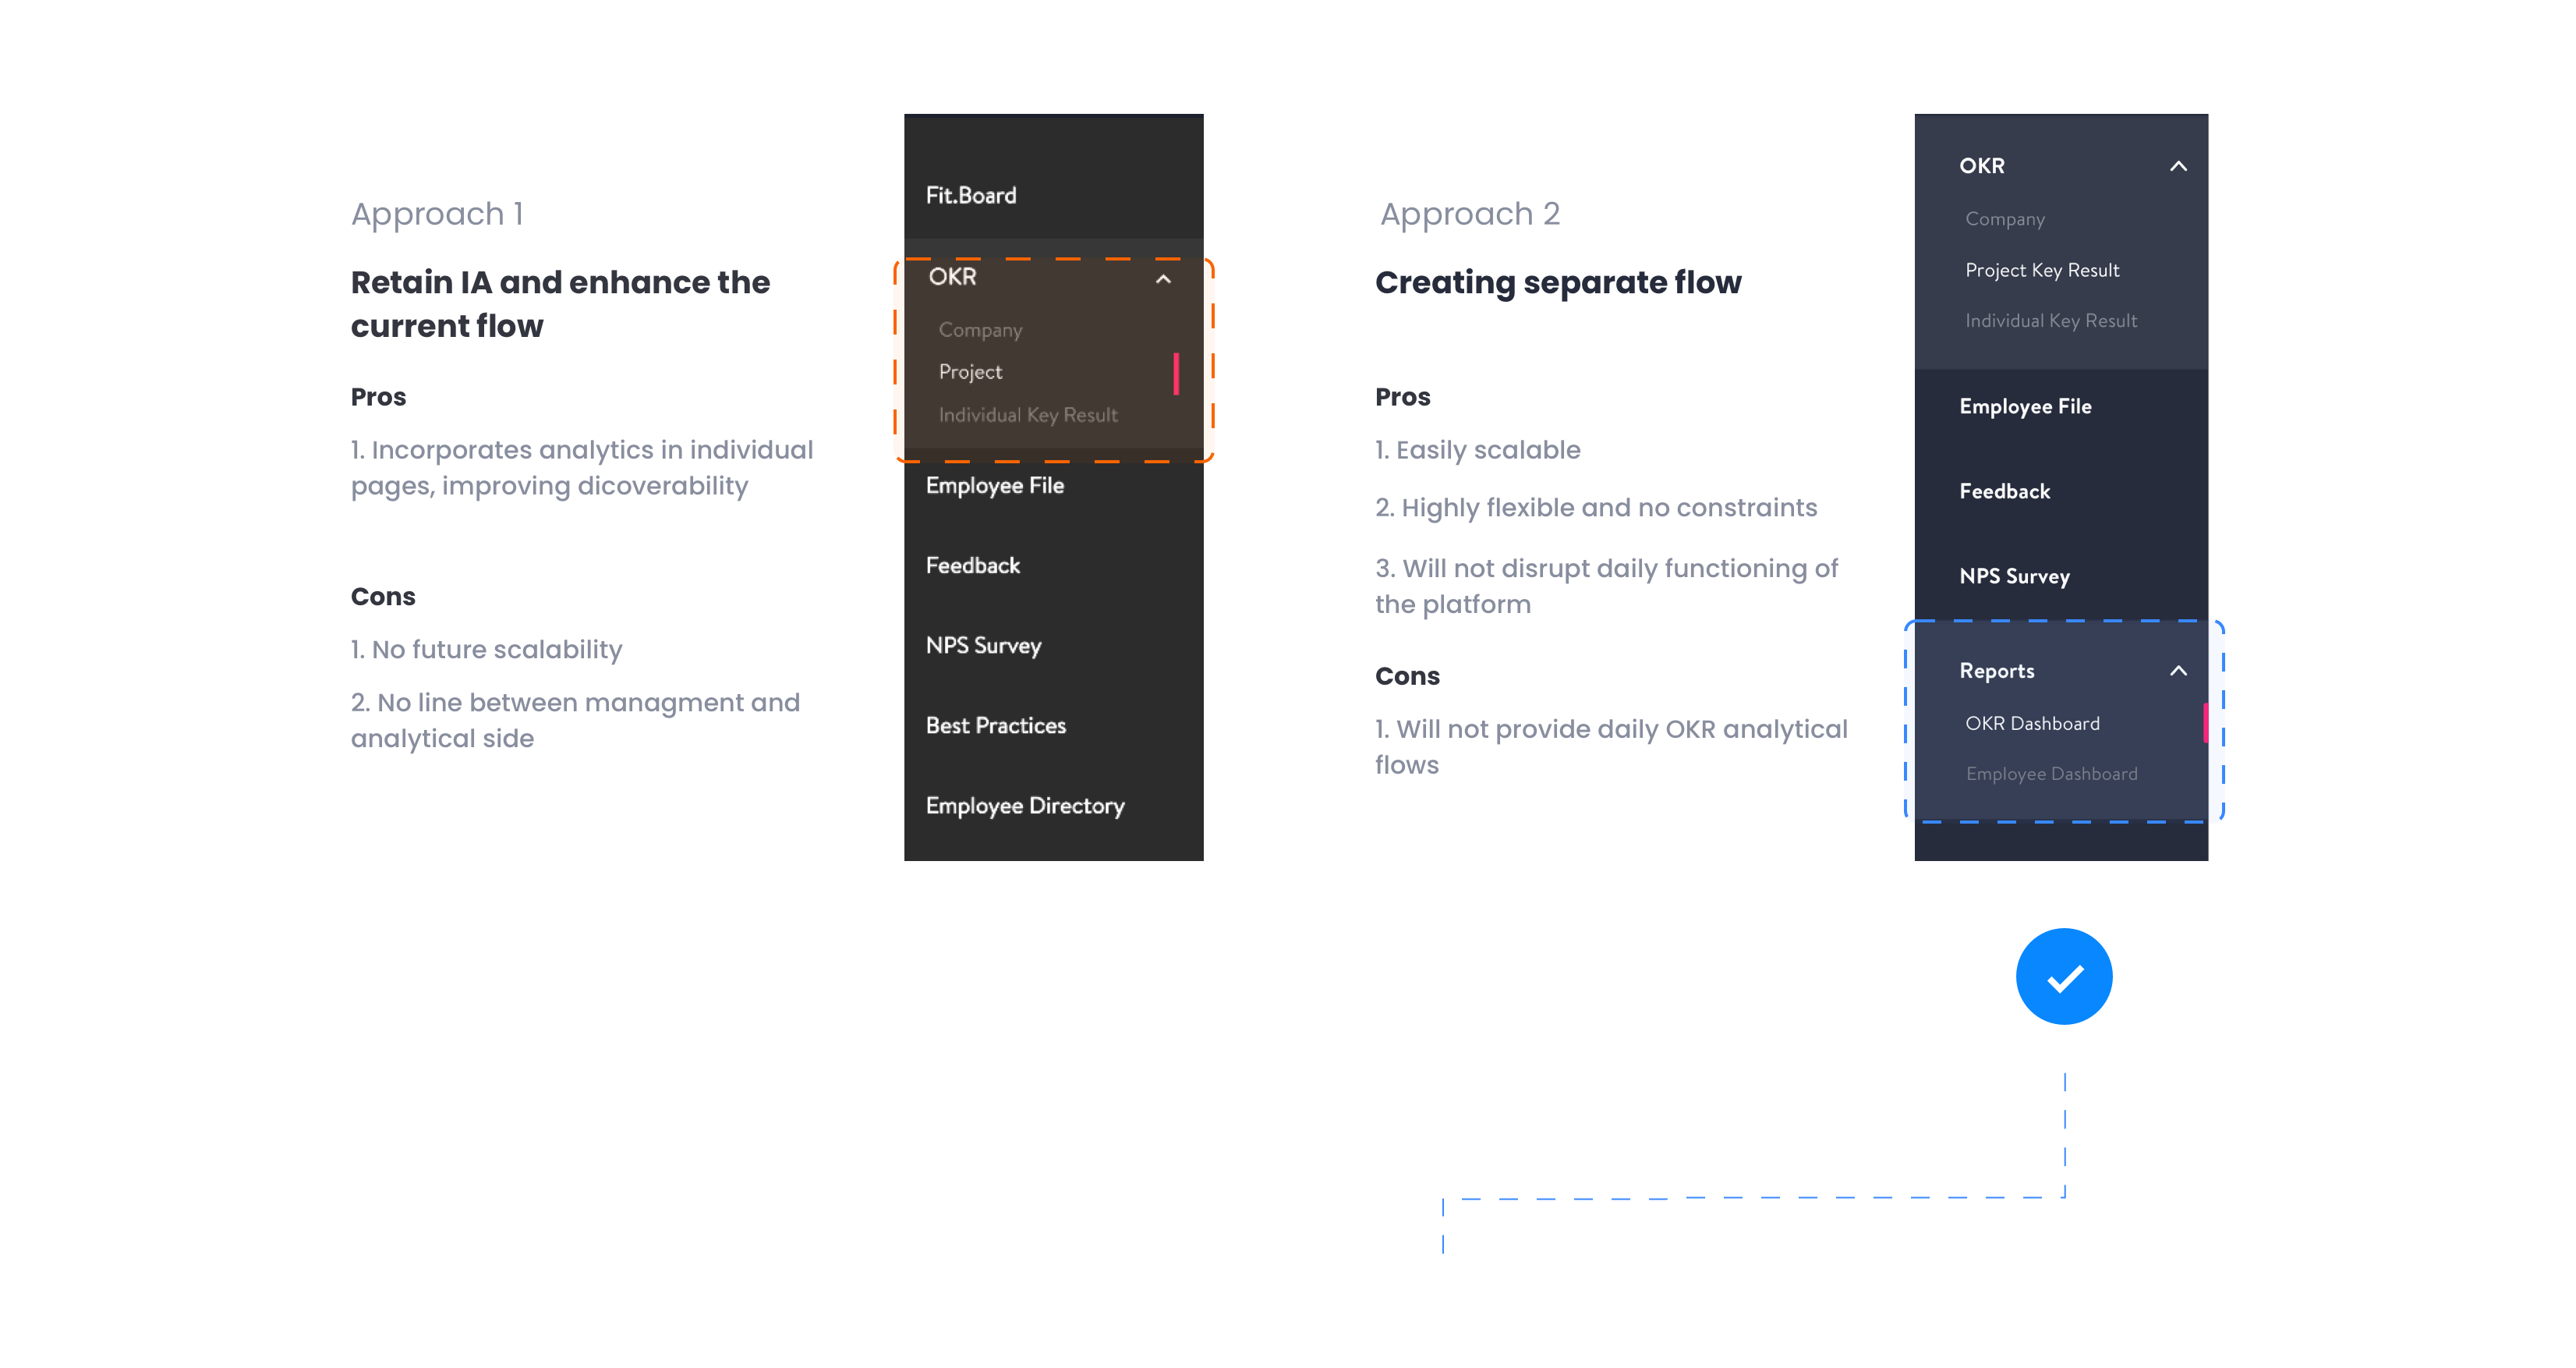
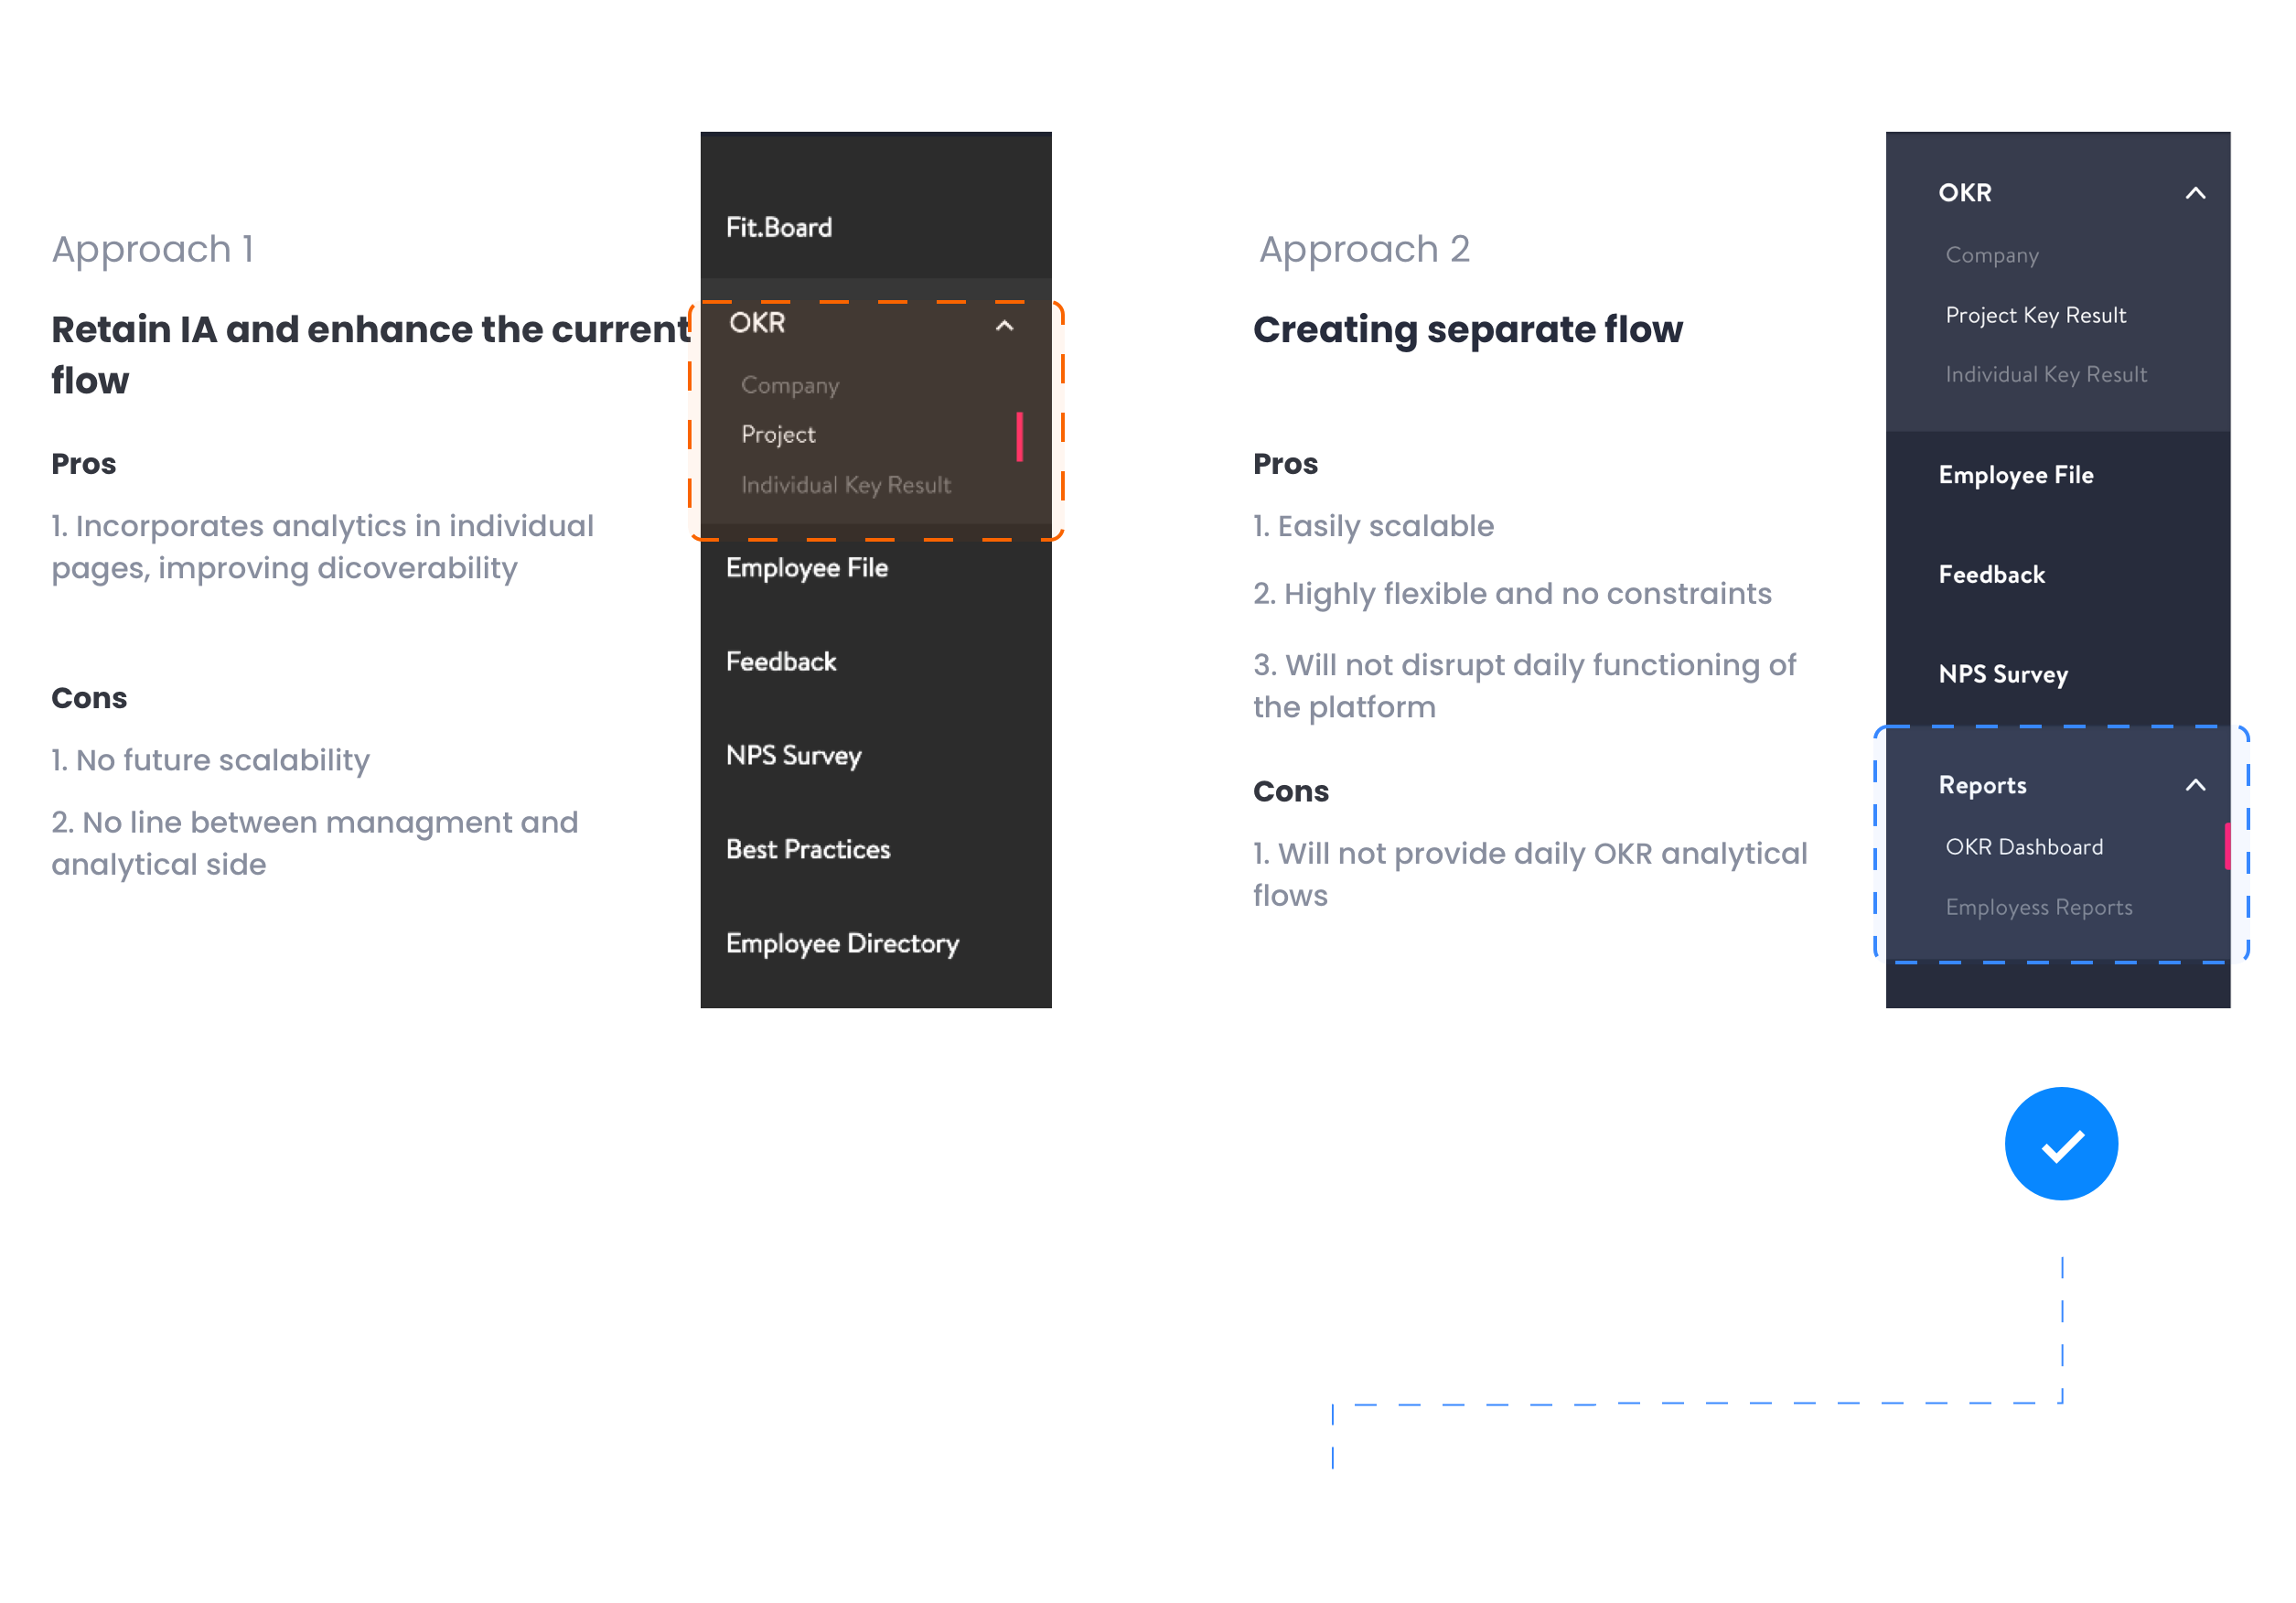
While working on IA it is essential to keep in mind the problem and make sure you know the product roadmap properly.
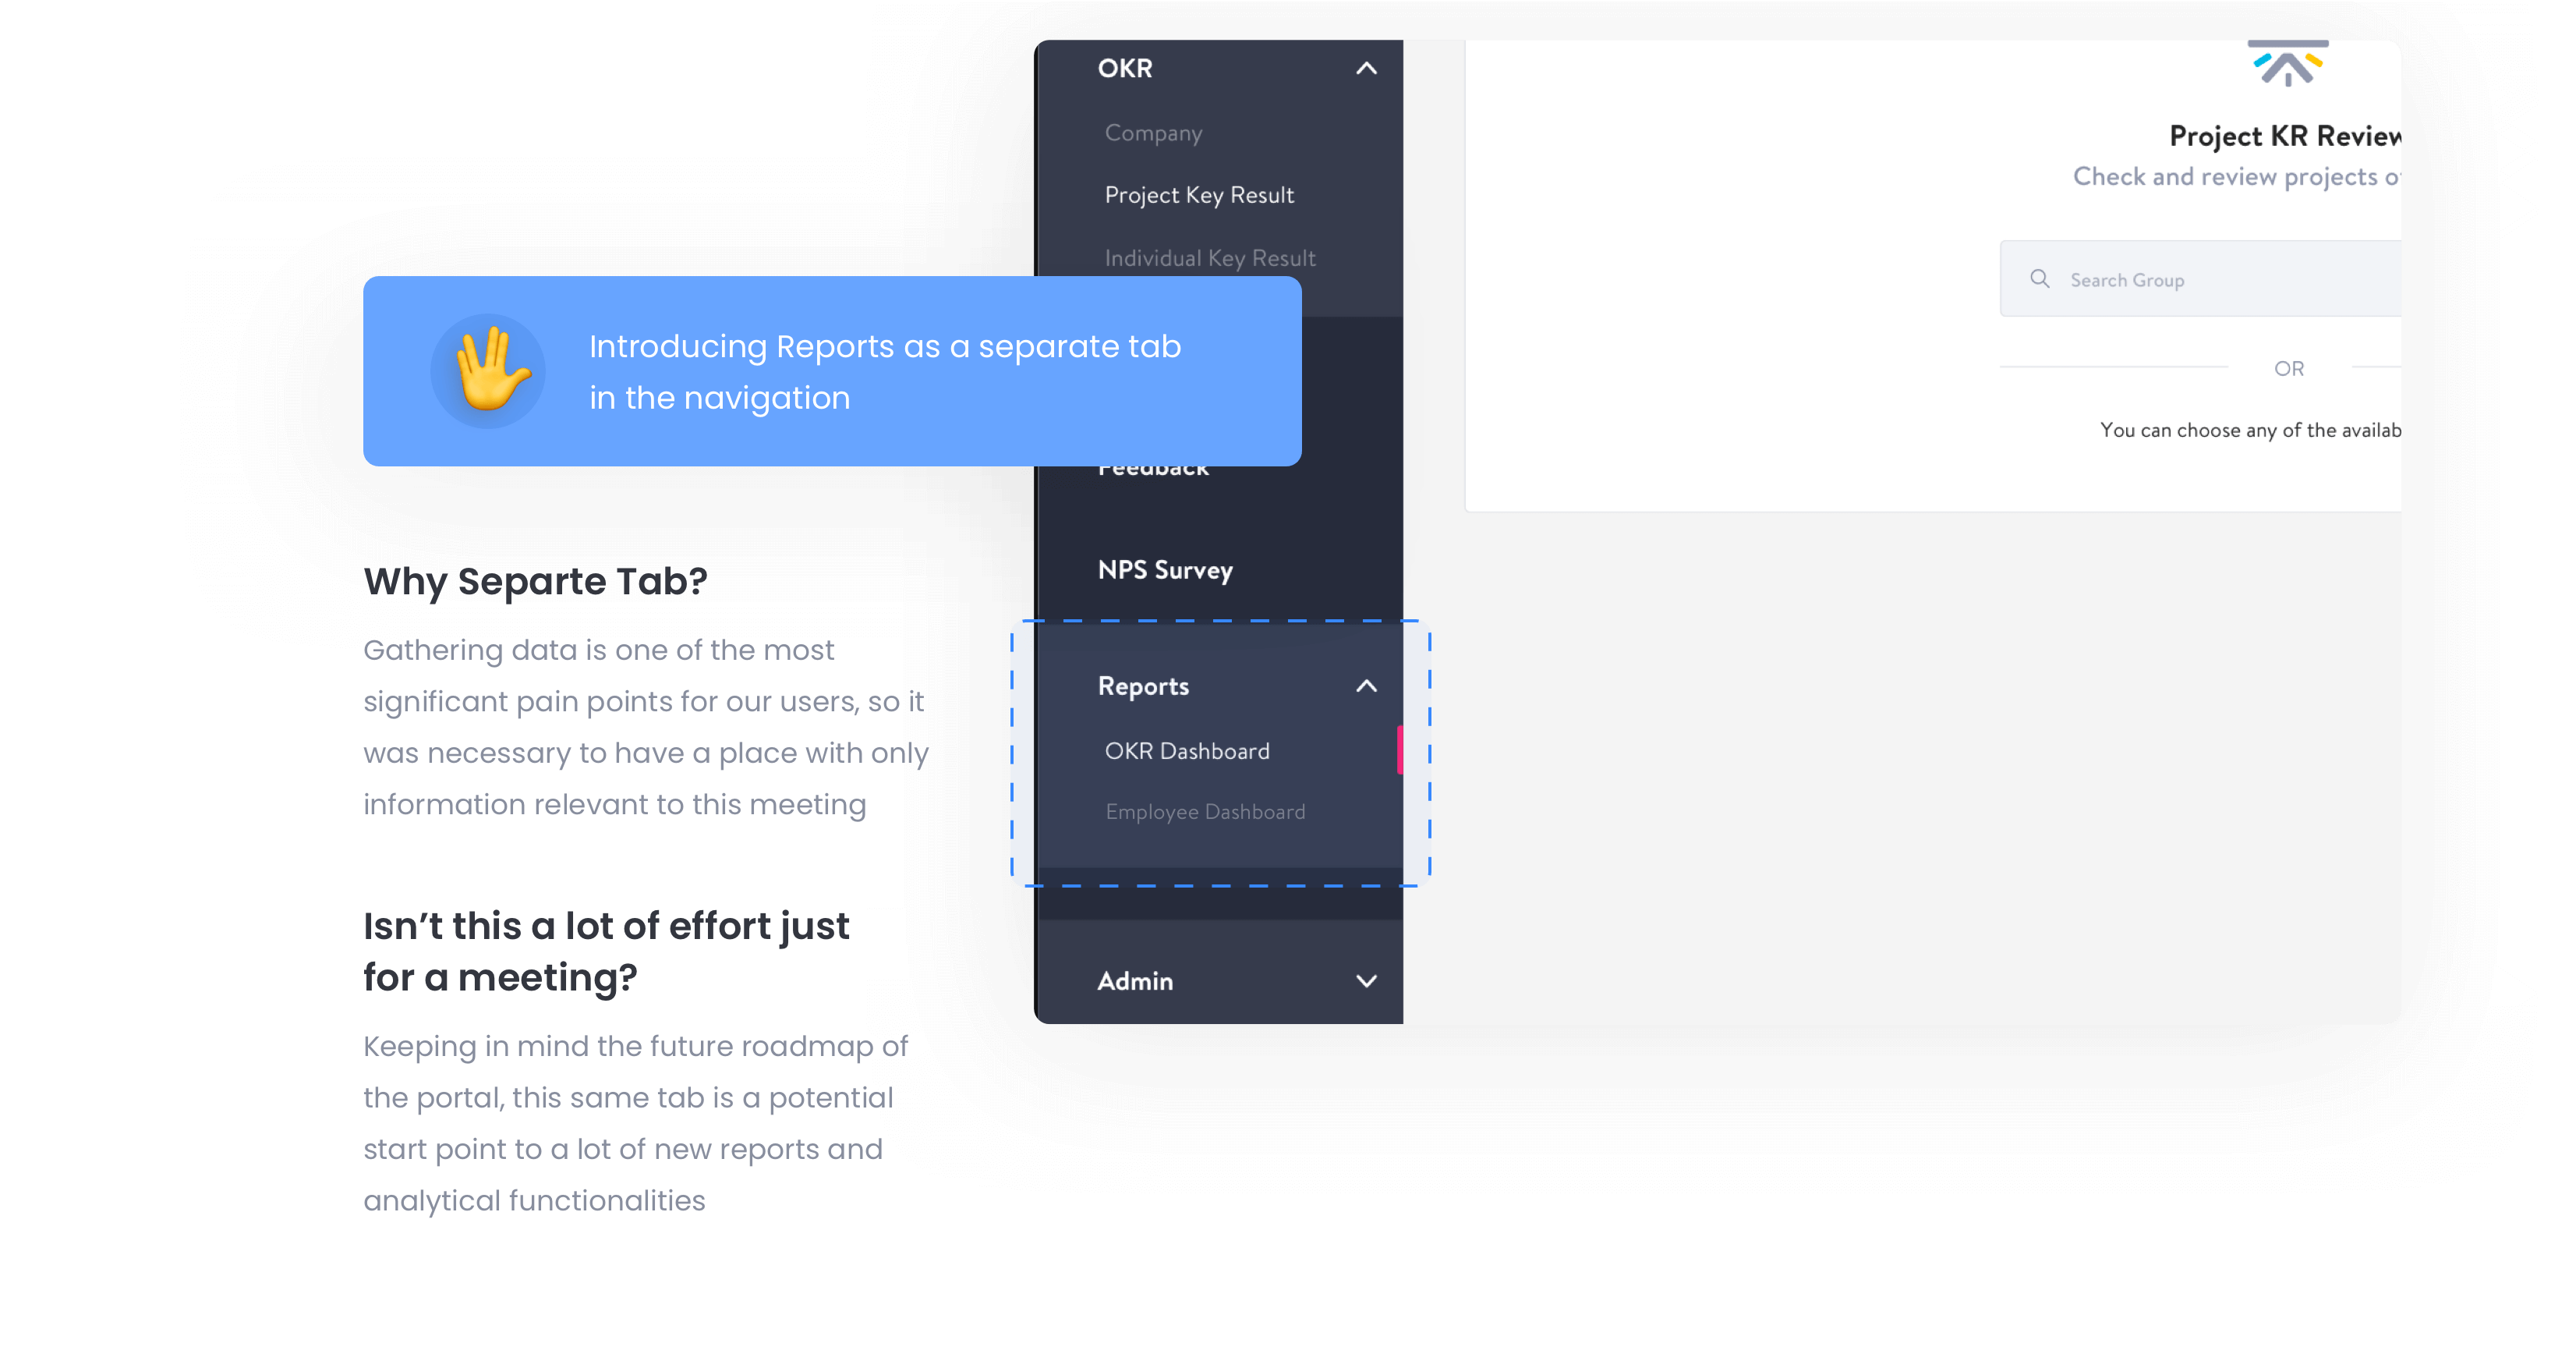
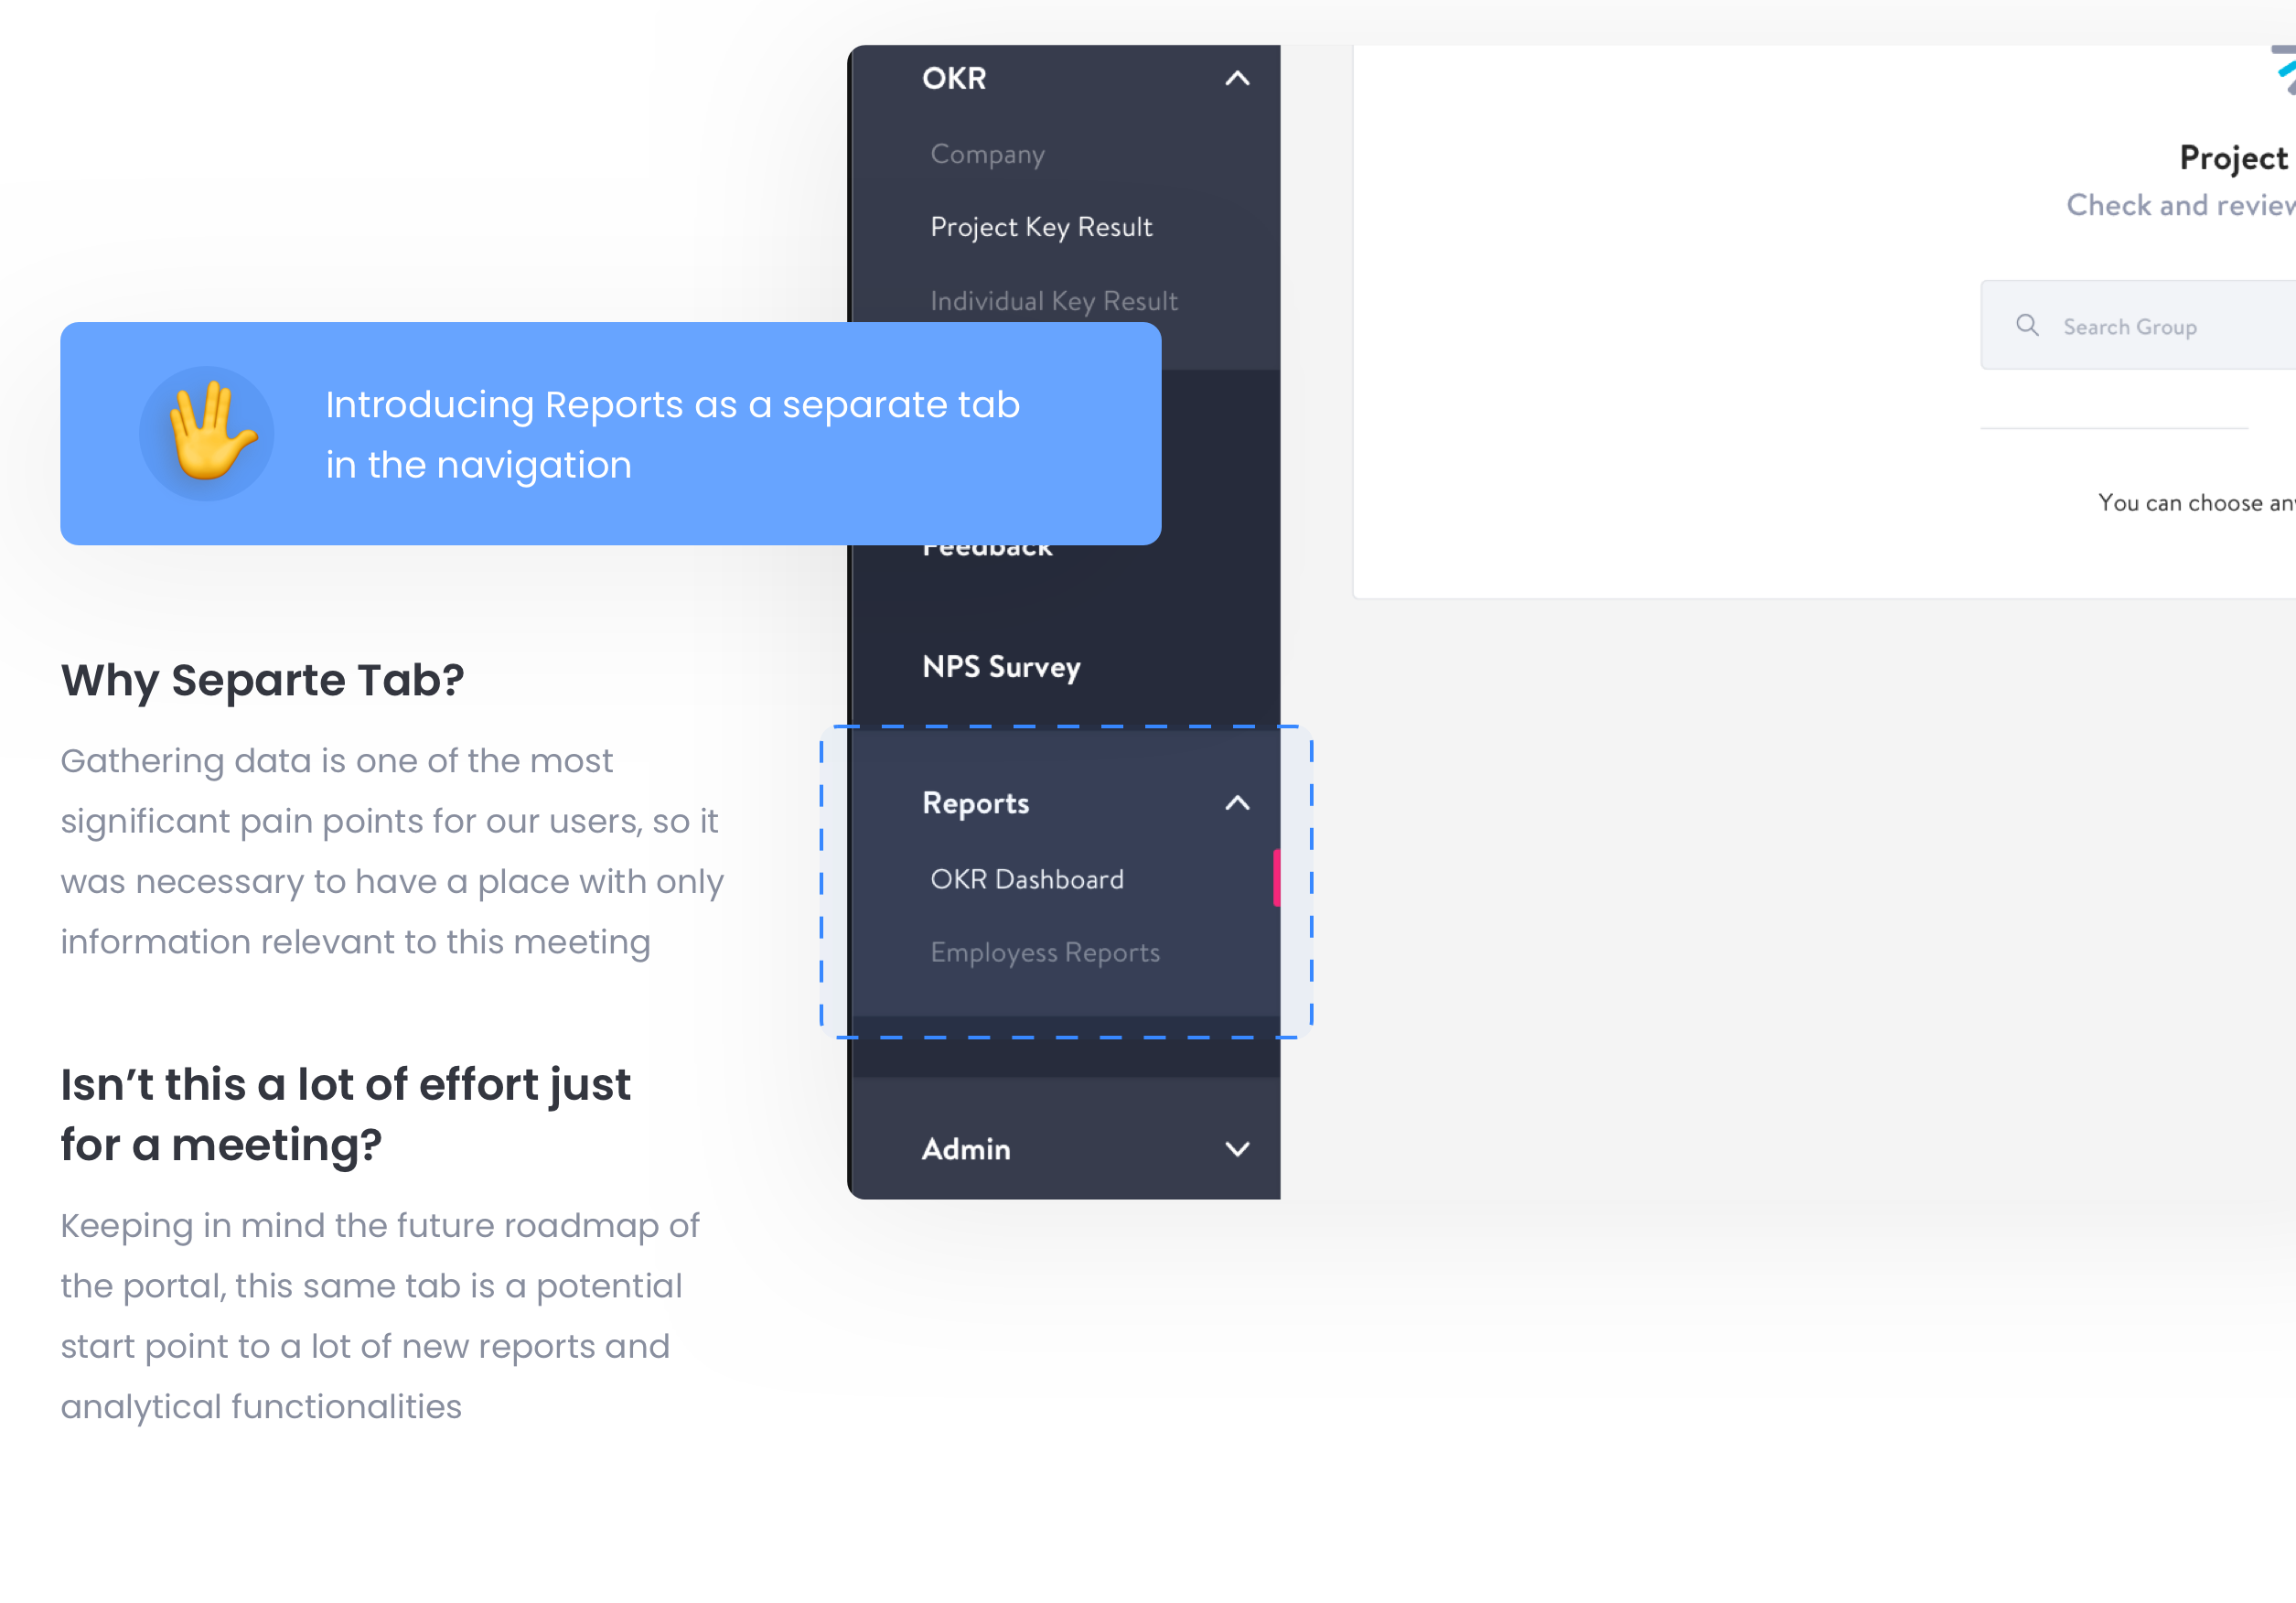
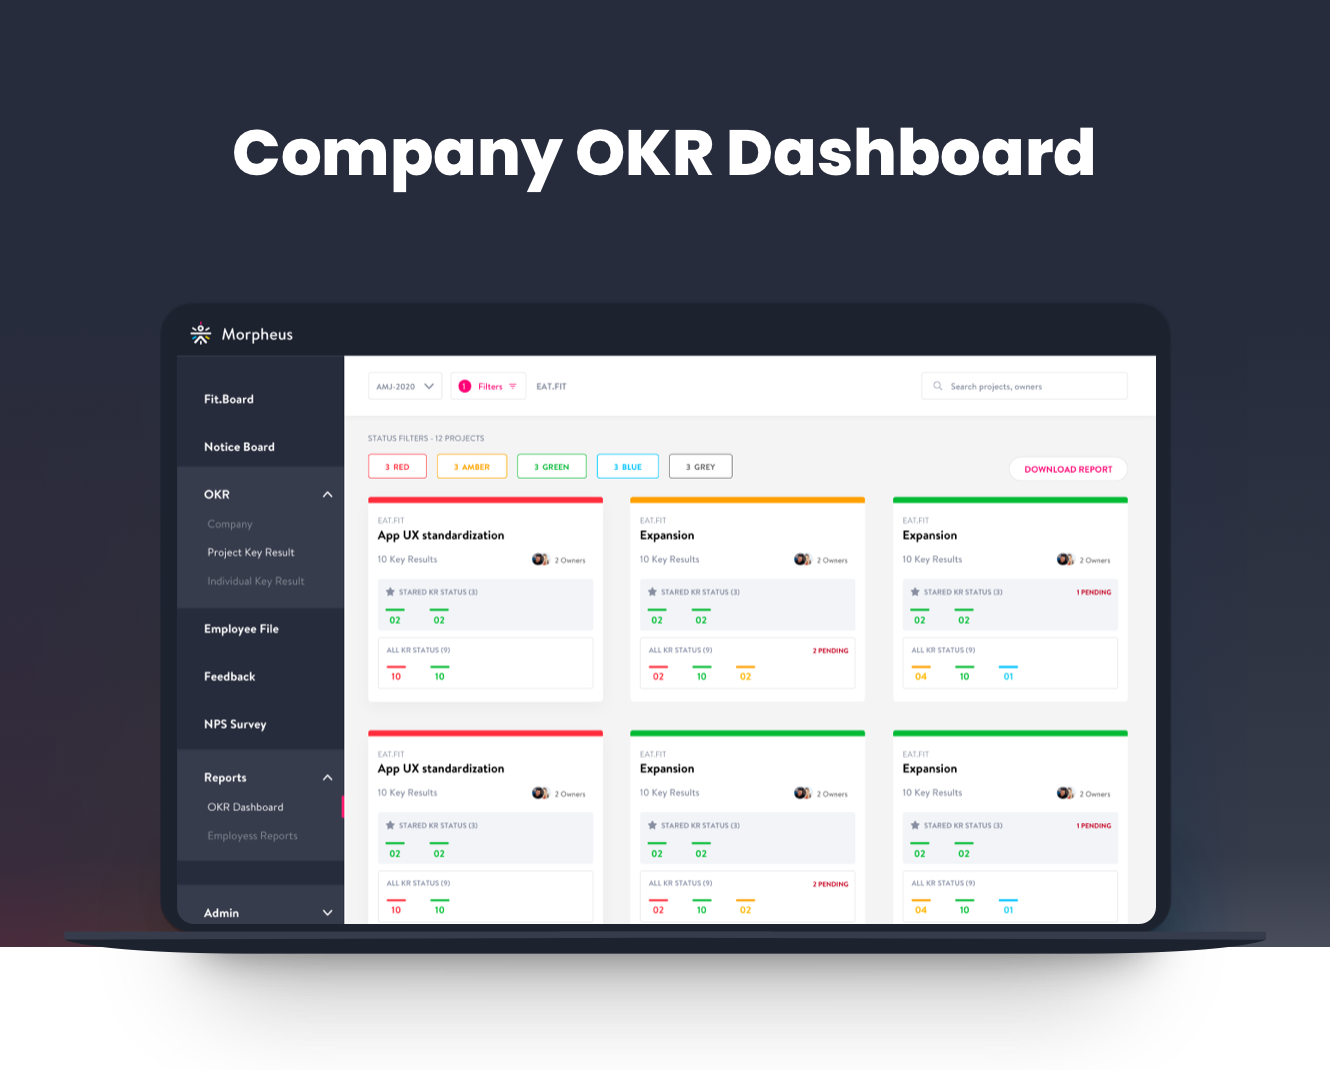
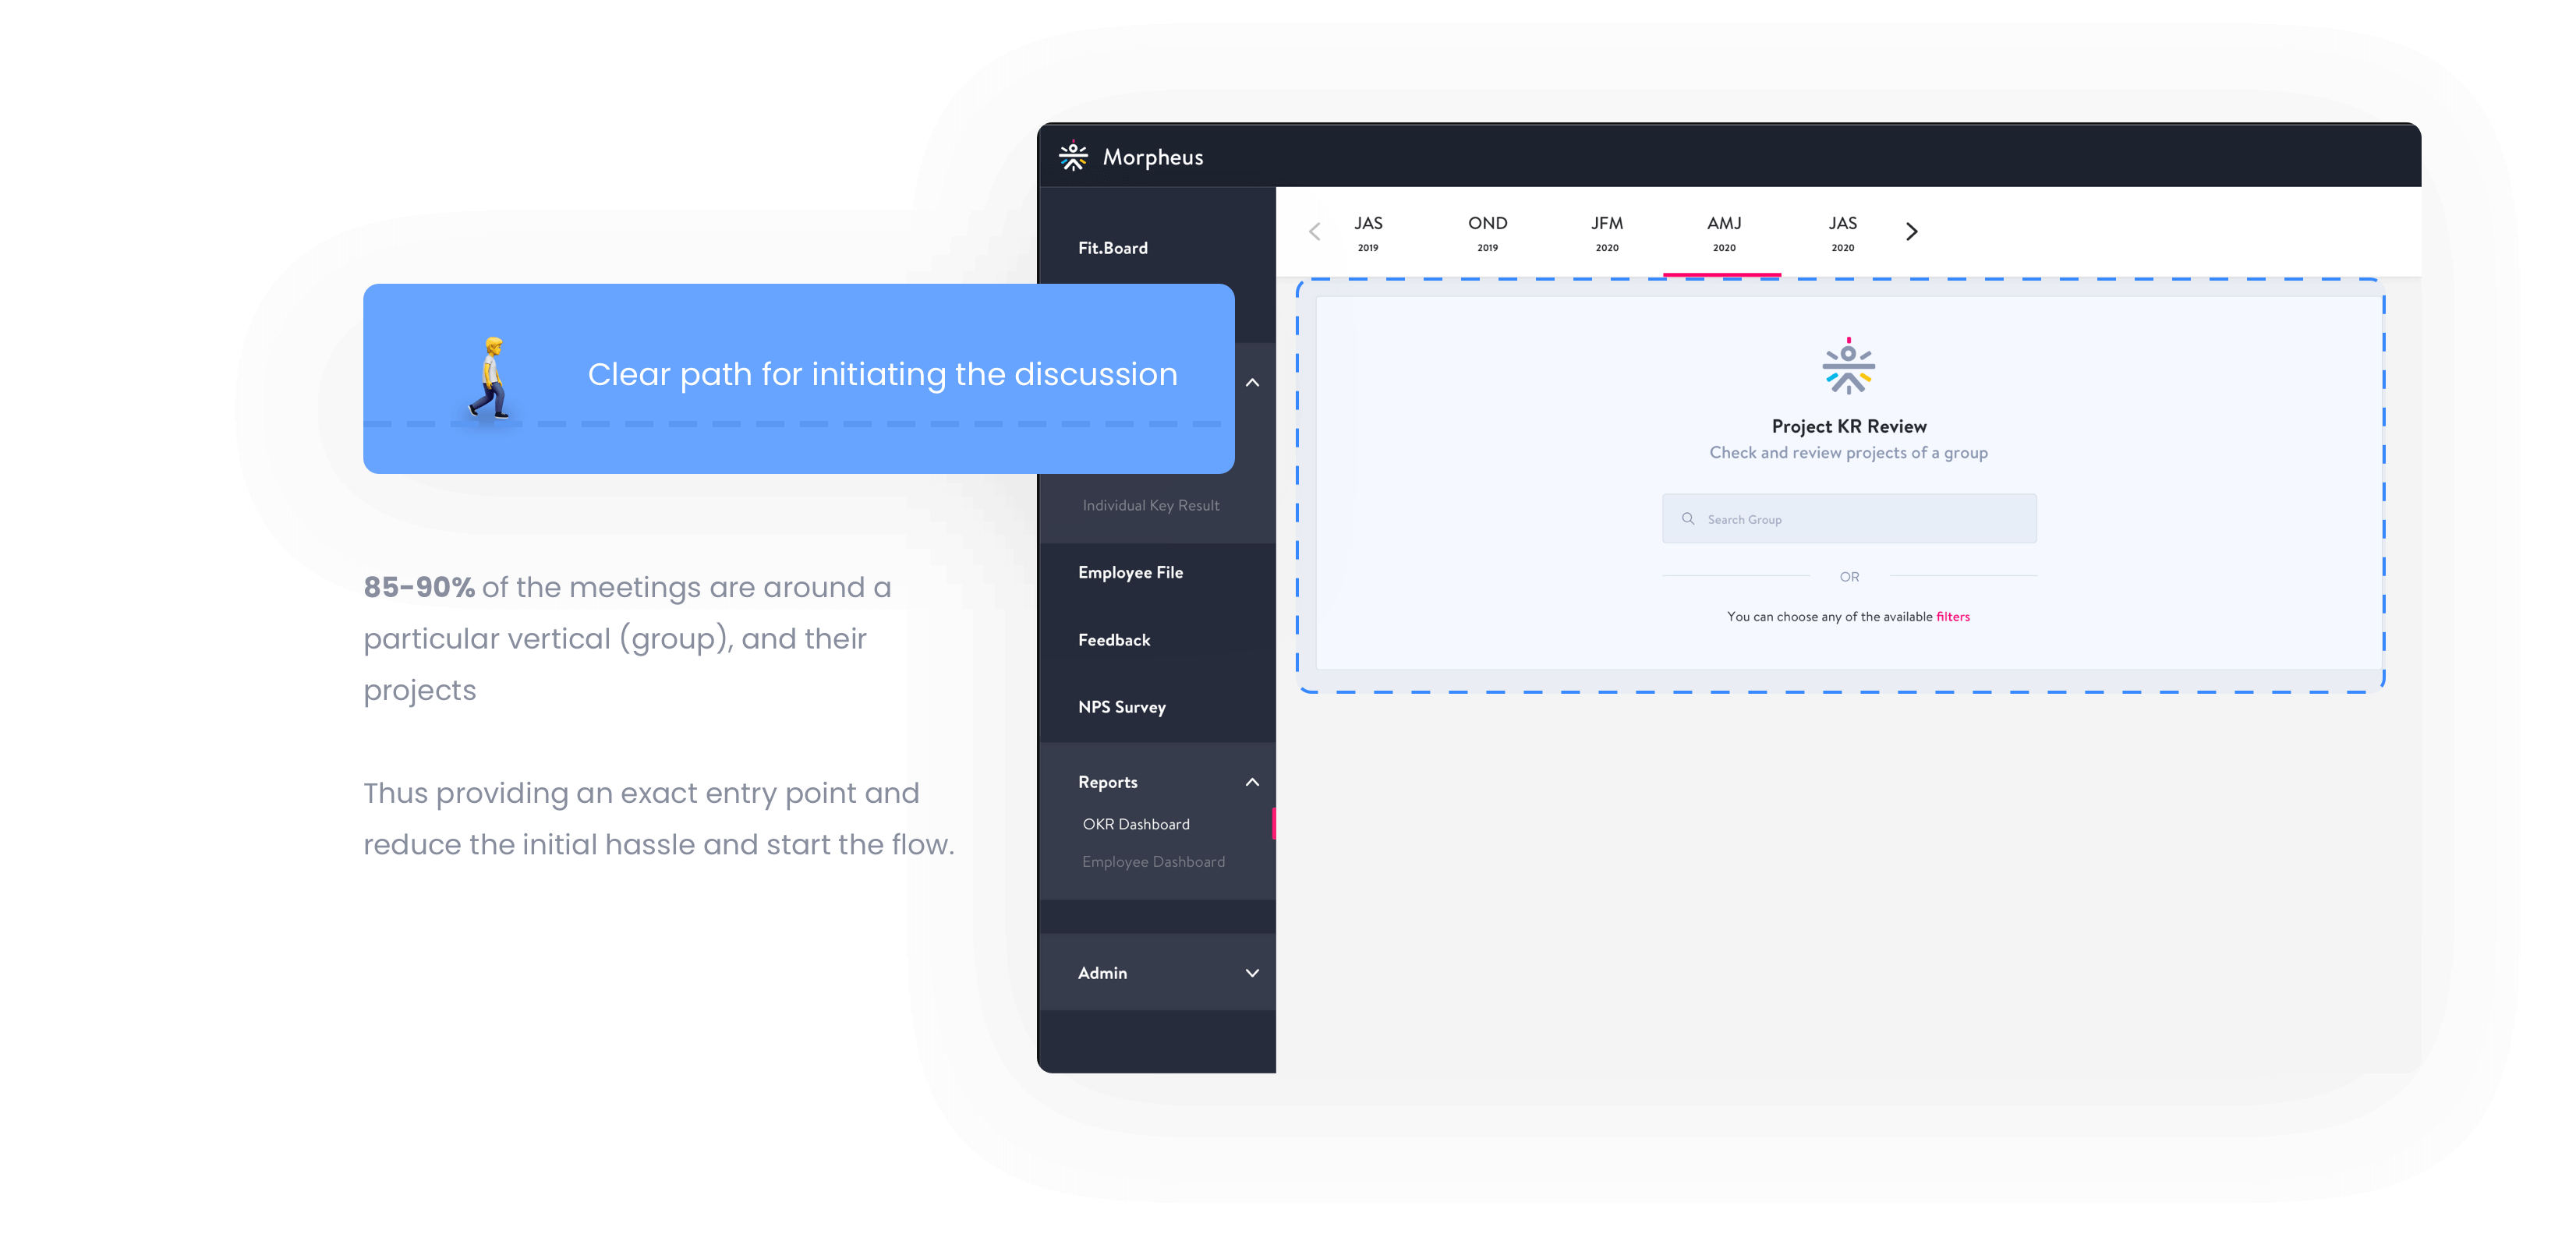
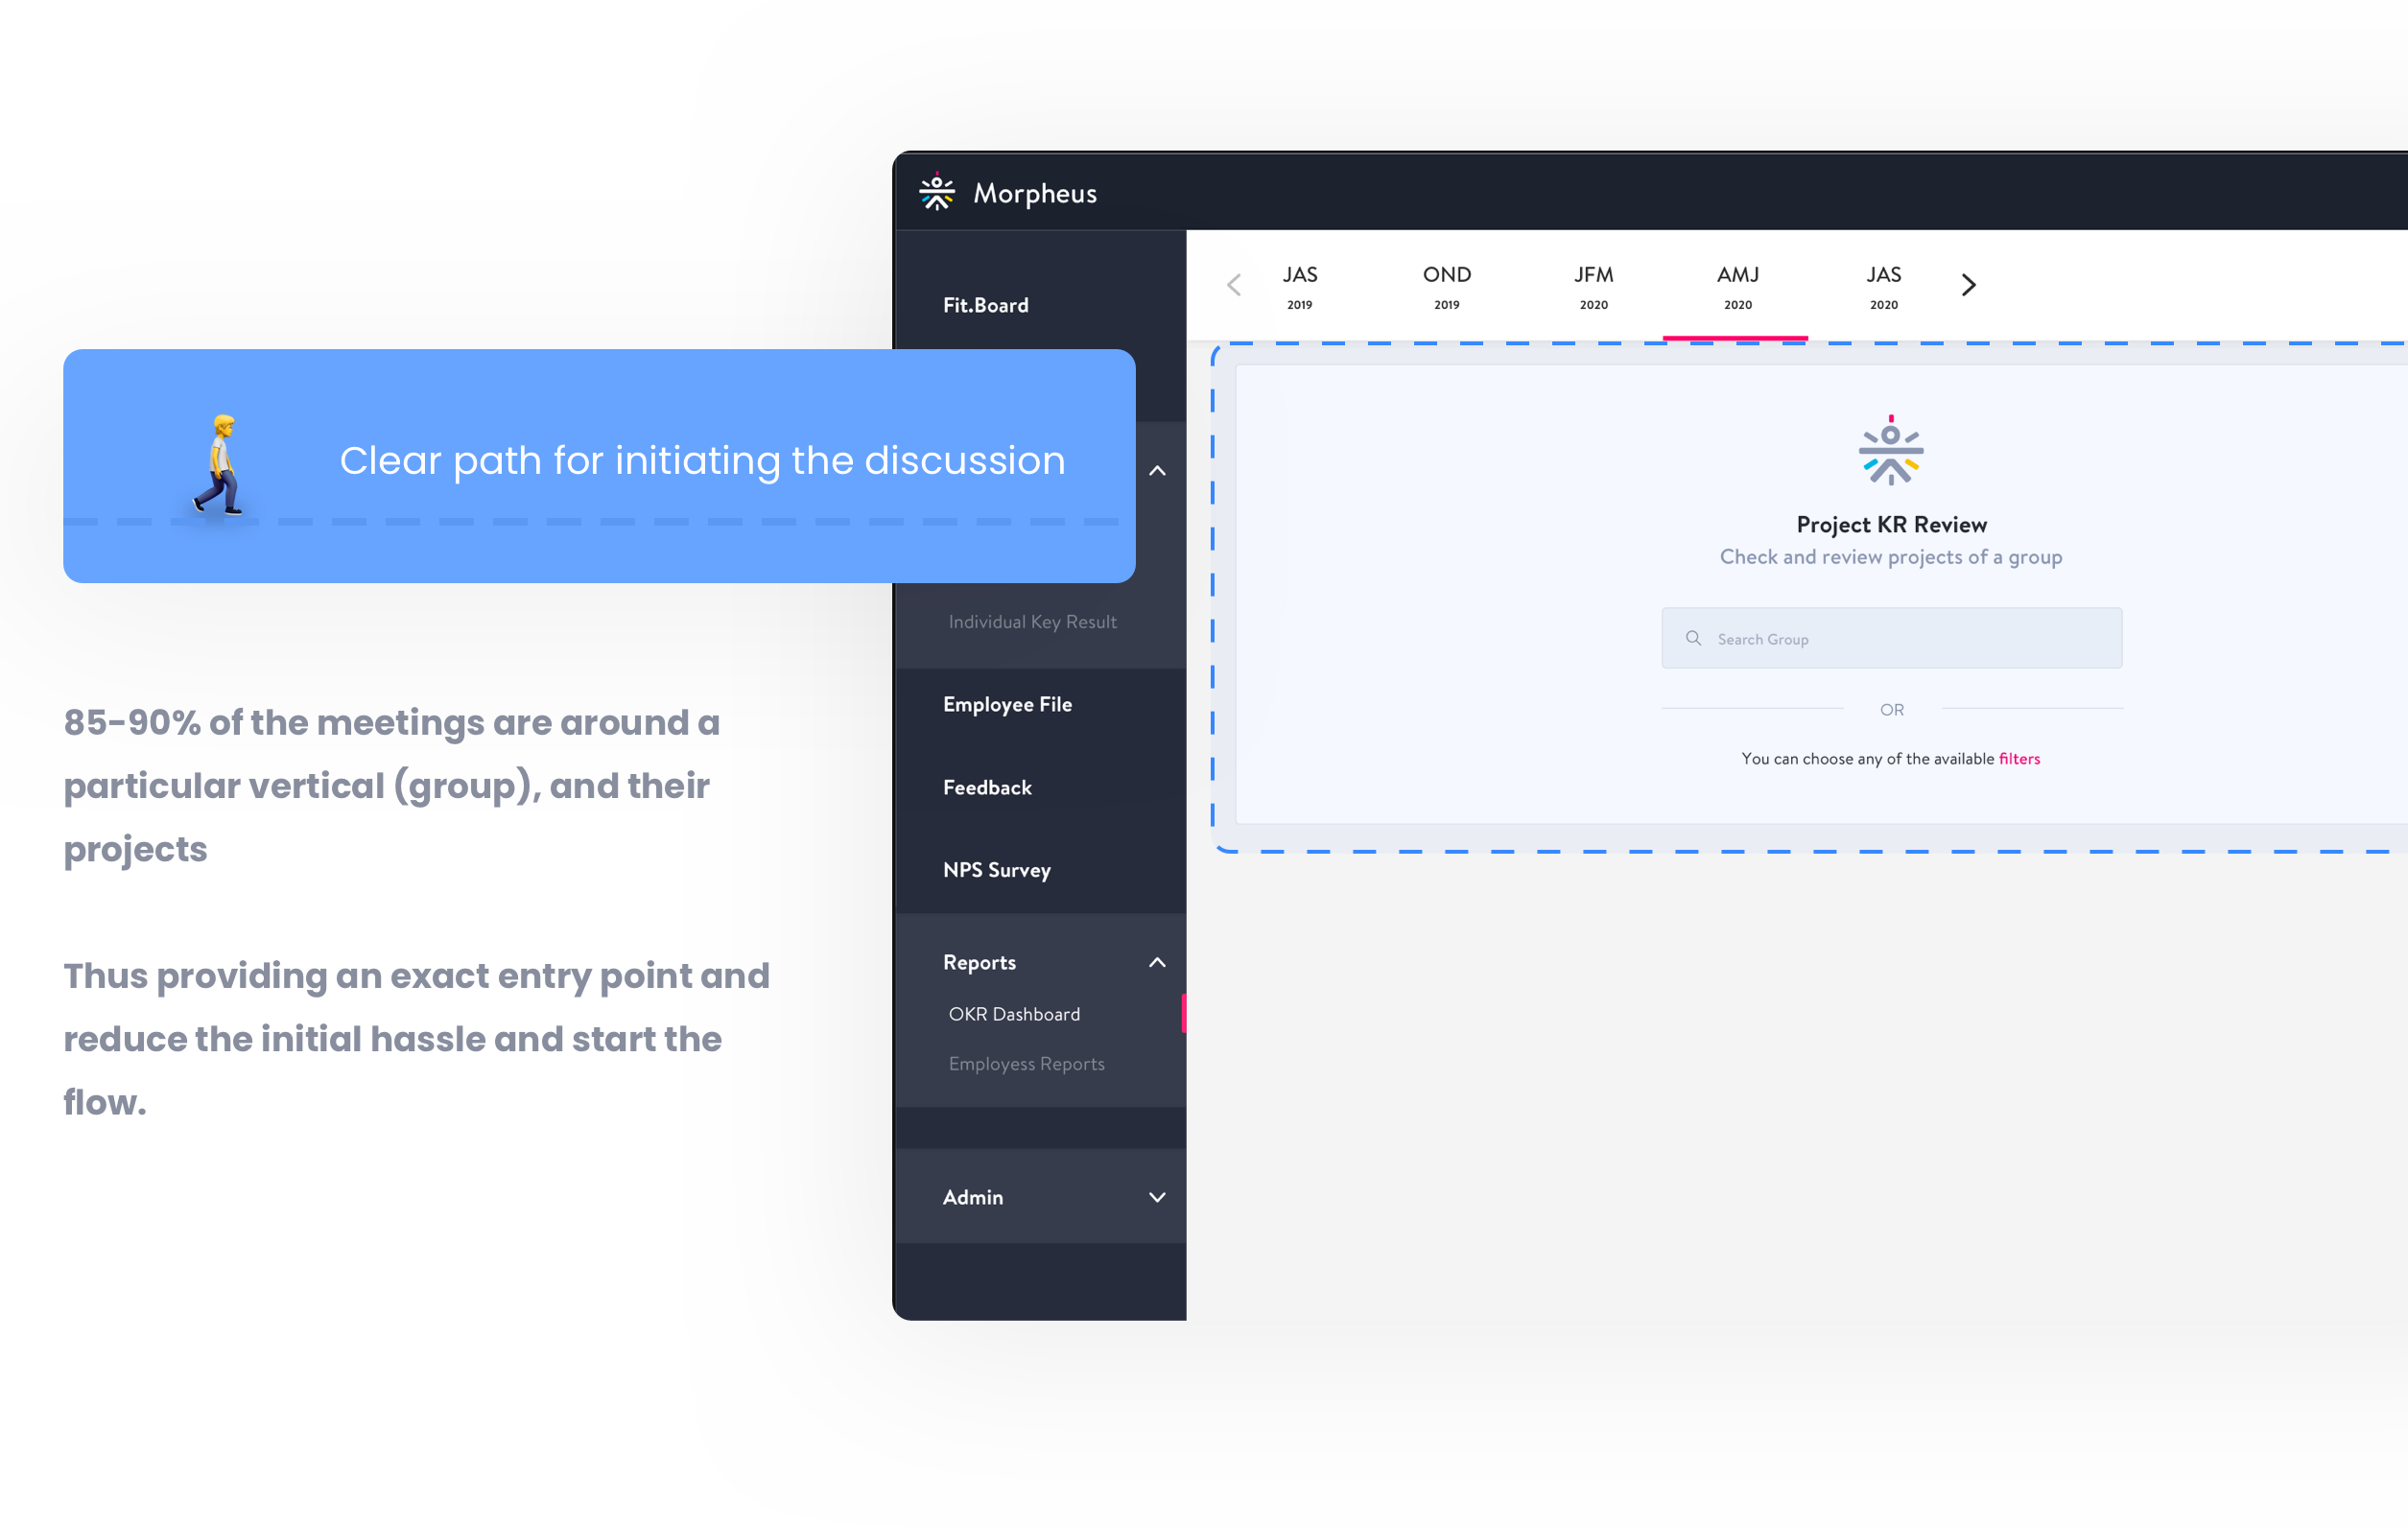
Having an exact starting point and way to find the projects, thus saving crucial time of the meeting.
During a discussion, red statuses are of utmost importance; with the color driven approach, the discussion can be driven according to the status colors.
Focusing more on the latest status color of KRs in a project and not the comments. Thus reducing all distractions and extra information behind a click.
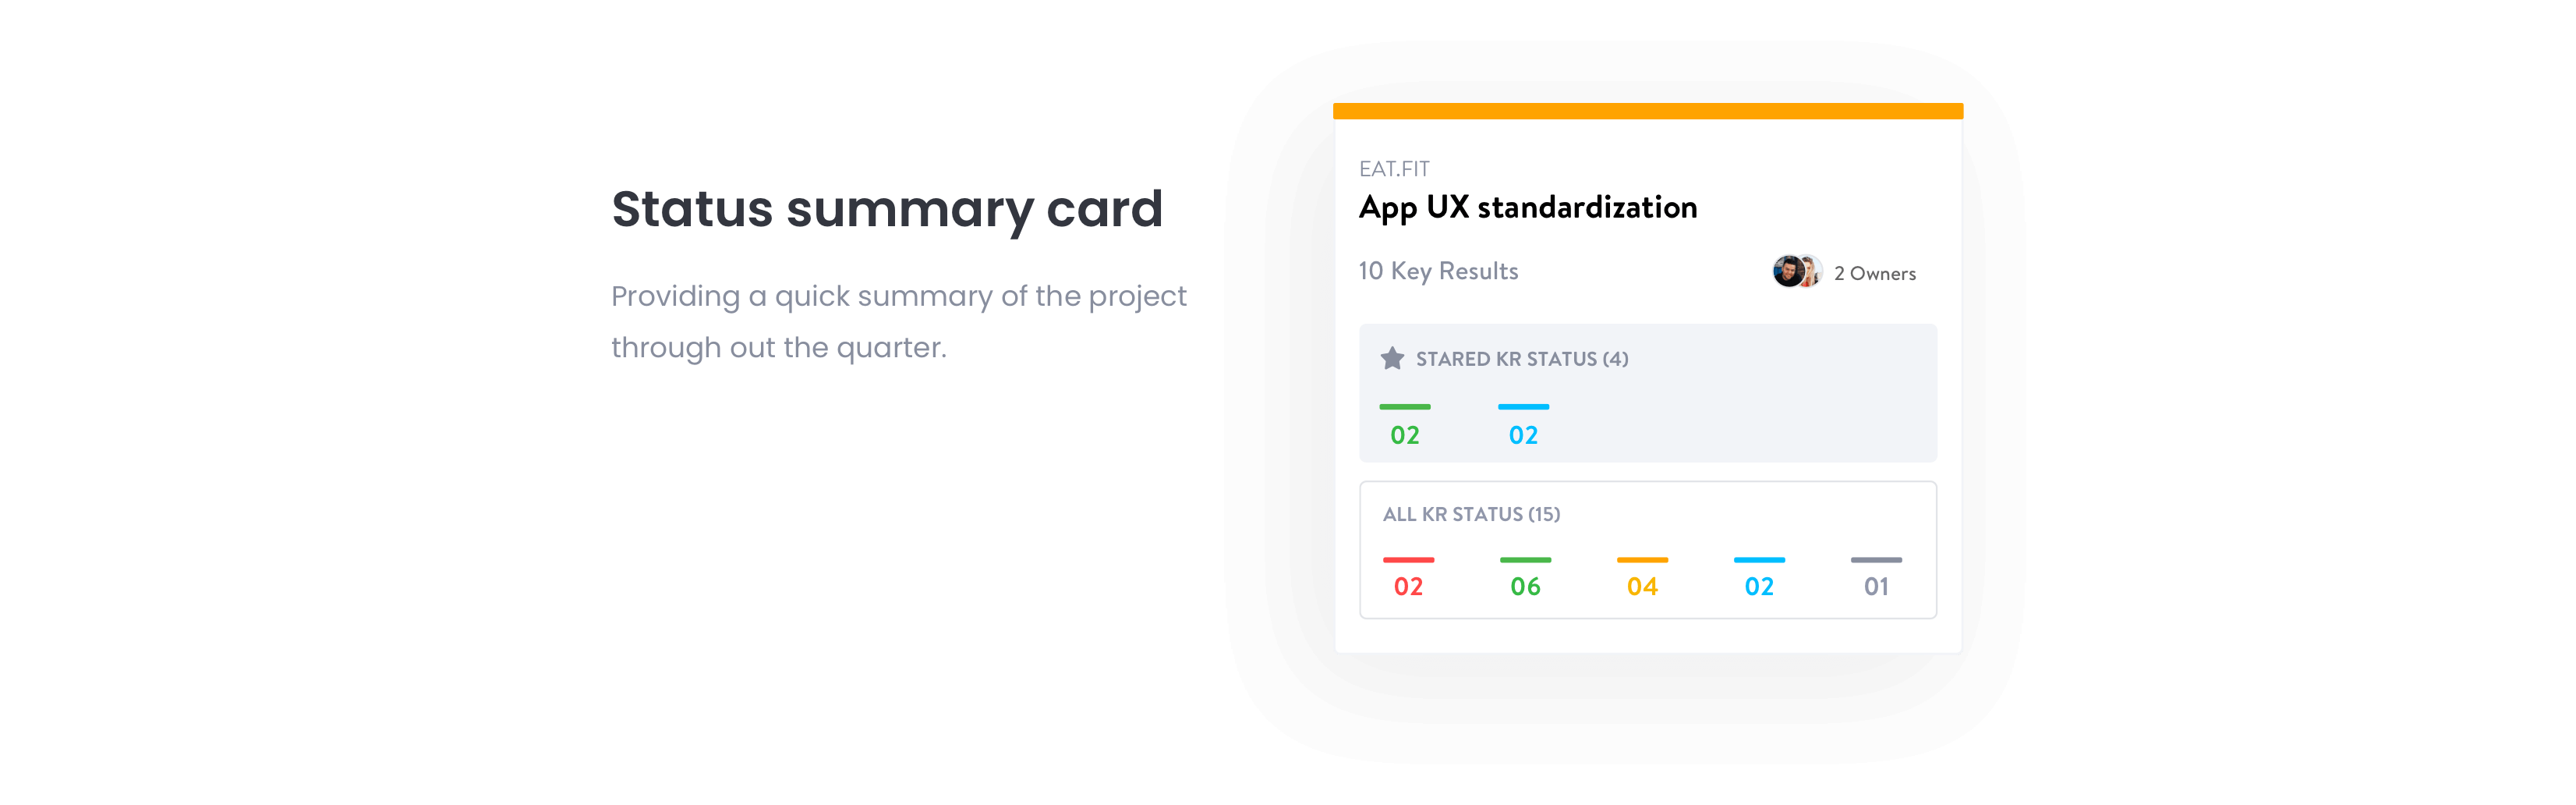
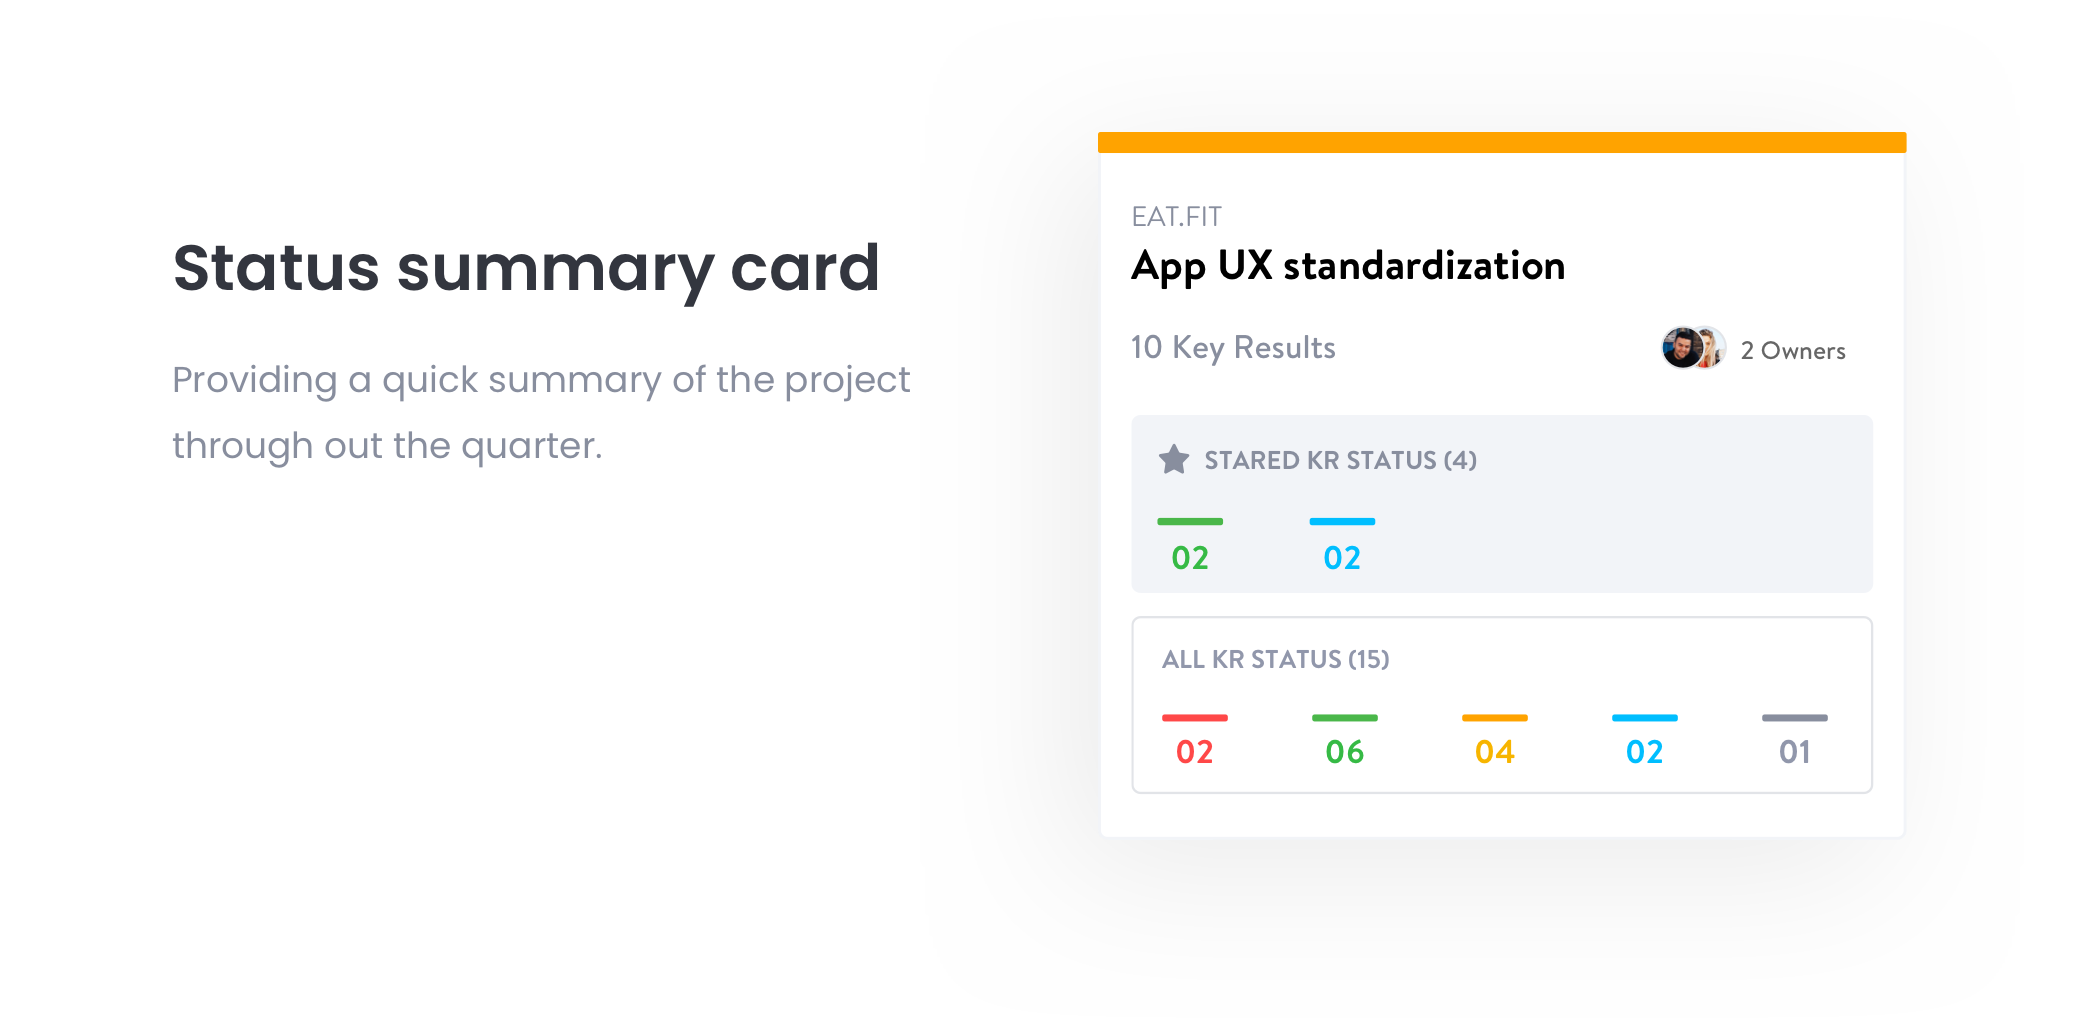
Users can dive into details of the project KRs and individual KRs without navigating to any other page.
OKR Dashboard launched before the quarter-end, and thus we were able to validate our solutions in multiple quarter-end meetings. Again user observation and user feedback was the mode of collecting qualitative data.


User feedbacks were satisfactory, people were aligned with the overall concept and most of them found it helpful. There were a few feedbacks on UI and scroll, which we iterated and optimized.
- Users are unpredictable: Users never behave the way we expect. As a designer, we should always be ready for unpredictable responses and iterating according to them.
- Alpha testing can be biased: Testing within the team and stakeholders can be biased and may/may not provide actual reflection. It is always better to Beta test on real users in real scenarios.
OKR dashboard is live and being used by people a Cure.fit, we are continuously working to solve for better analysis for the OKRs both at company and individual level.